 12
12peptides
spectra
0.000 | 0.000
0.062 | 0.082
0.000 | 0.000
0.000 | 0.000
0.000 | 0.026
0.052 | 0.086
0.838 | 0.849
0.000 | 0.000
| Plot | Mito | Lyso | Perox | ER | Golgi | PM | Cytosol | Nucleus | |||||
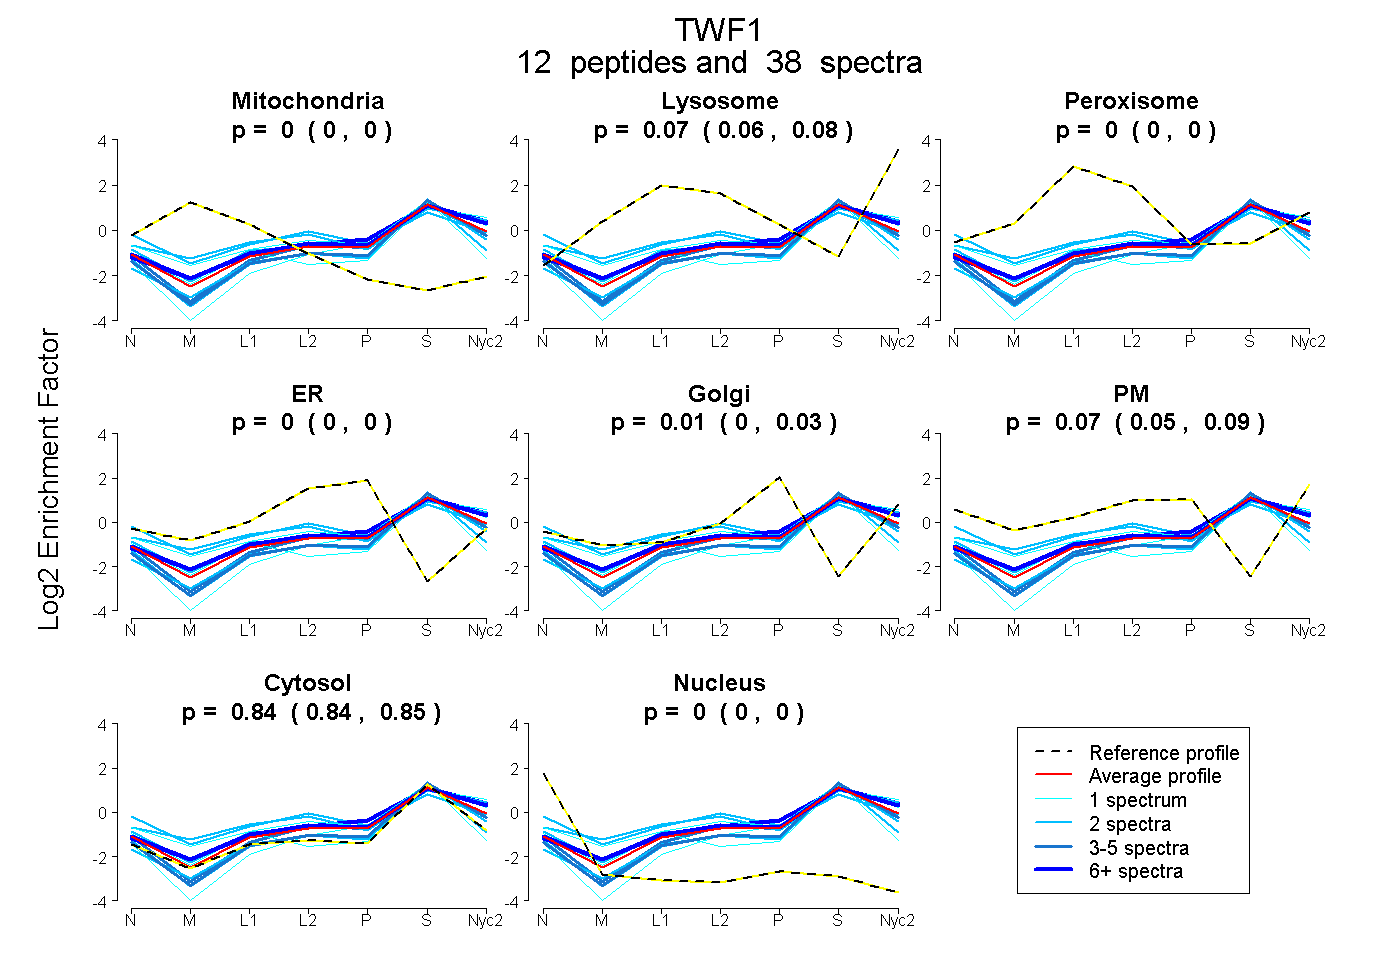
| Expt A |
12 peptides |
38 spectra |
|
0.000 0.000 | 0.000 |
0.073 0.062 | 0.082 |
0.000 0.000 | 0.000 |
0.000 0.000 | 0.000 |
0.012 0.000 | 0.026 |
0.071 0.052 | 0.086 |
0.844 0.838 | 0.849 |
0.000 0.000 | 0.000 |
| 2 spectra, HQTLQGVAFPISR | 0.000 | 0.105 | 0.000 | 0.000 | 0.041 | 0.090 | 0.764 | 0.000 | ||
| 2 spectra, GPAEAEATTD | 0.000 | 0.000 | 0.155 | 0.000 | 0.000 | 0.211 | 0.635 | 0.000 | ||
| 1 spectrum, QLQMDVIR | 0.000 | 0.180 | 0.000 | 0.000 | 0.000 | 0.123 | 0.697 | 0.000 | ||
| 1 spectrum, ISEVQTDVSVDTK | 0.000 | 0.111 | 0.000 | 0.000 | 0.000 | 0.000 | 0.889 | 0.000 | ||
| 4 spectra, DAFQALEK | 0.000 | 0.014 | 0.000 | 0.000 | 0.051 | 0.045 | 0.890 | 0.000 | ||
| 7 spectra, MLYAATR | 0.000 | 0.161 | 0.000 | 0.000 | 0.091 | 0.000 | 0.748 | 0.000 | ||
| 1 spectrum, QPCYVLFR | 0.000 | 0.000 | 0.000 | 0.000 | 0.000 | 0.000 | 0.985 | 0.015 | ||
| 9 spectra, YHFFLYK | 0.000 | 0.171 | 0.000 | 0.000 | 0.043 | 0.000 | 0.786 | 0.000 | ||
| 2 spectra, NETIILANTENTELK | 0.000 | 0.151 | 0.117 | 0.000 | 0.000 | 0.081 | 0.651 | 0.000 | ||
| 2 spectra, QSFAKPK | 0.000 | 0.000 | 0.000 | 0.000 | 0.020 | 0.000 | 0.980 | 0.000 | ||
| 2 spectra, MLYSSCK | 0.000 | 0.000 | 0.000 | 0.000 | 0.000 | 0.000 | 1.000 | 0.000 | ||
| 5 spectra, SPLLDIVER | 0.000 | 0.014 | 0.000 | 0.000 | 0.015 | 0.000 | 0.971 | 0.000 |
| Plot | Mito | Lyso or Perox | ER | Golgi | PM | Cytosol | Nucleus | ||||||
| Expt B |
3 peptides |
6 spectra |
 |
0.000 0.000 | 0.000 |
0.027 0.000 | 0.099 |
0.042 0.000 | 0.066 |
0.000 0.000 | 0.000 |
0.000 0.000 | 0.026 |
0.930 0.887 | 0.955 |
0.000 0.000 | 0.000 |
|||
| Plot | Lyso | Other | |||||||||||
| Expt C |
11 peptides |
41 spectra |
 |
0.000 0.000 | 0.000 |
1.000 1.000 | 1.000 |
||||||||
| Plot | Lyso | Other | |||||||||||
| Expt D |
3 peptides |
5 spectra |
 |
0.000 0.000 | 0.001 |
1.000 0.999 | 1.000 |