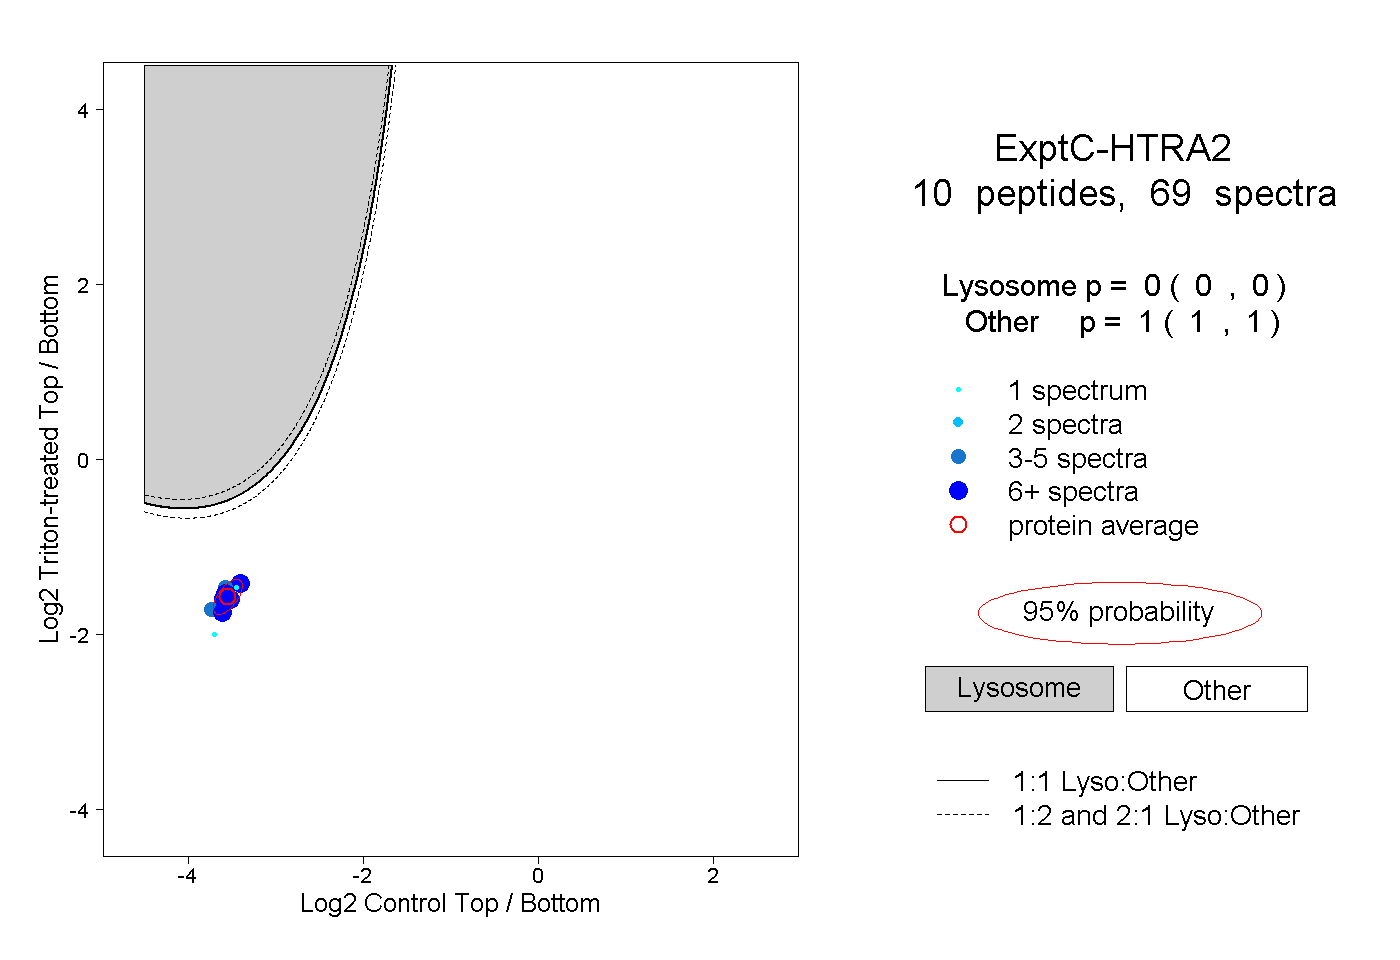
10
10peptides
spectra
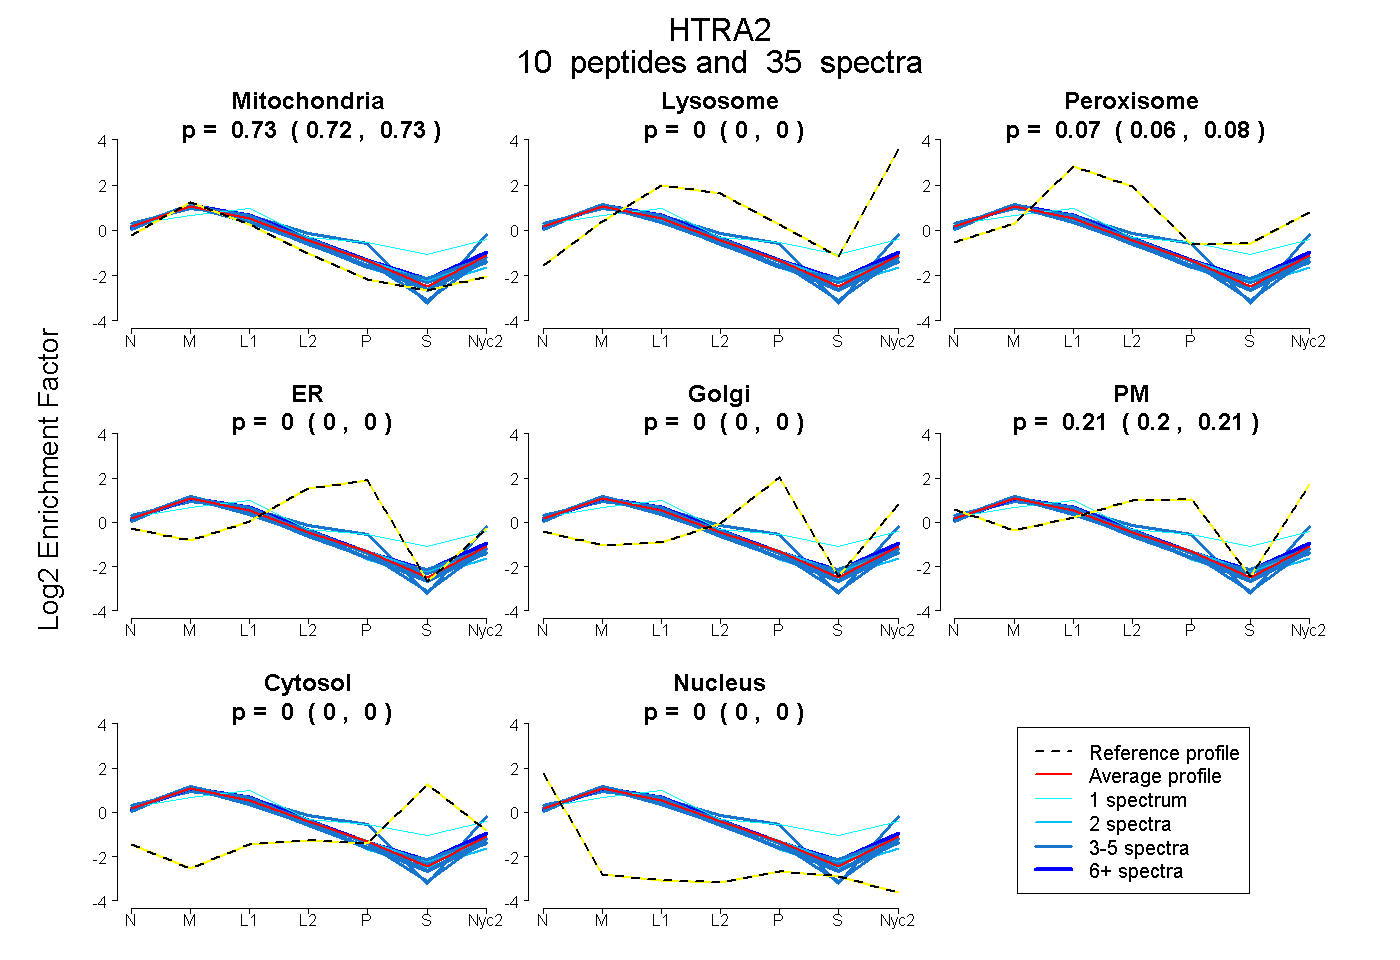
0.719 | 0.731
0.000 | 0.000
0.062 | 0.076
0.000 | 0.000
0.000 | 0.000
0.196 | 0.213
0.000 | 0.000
0.000 | 0.000
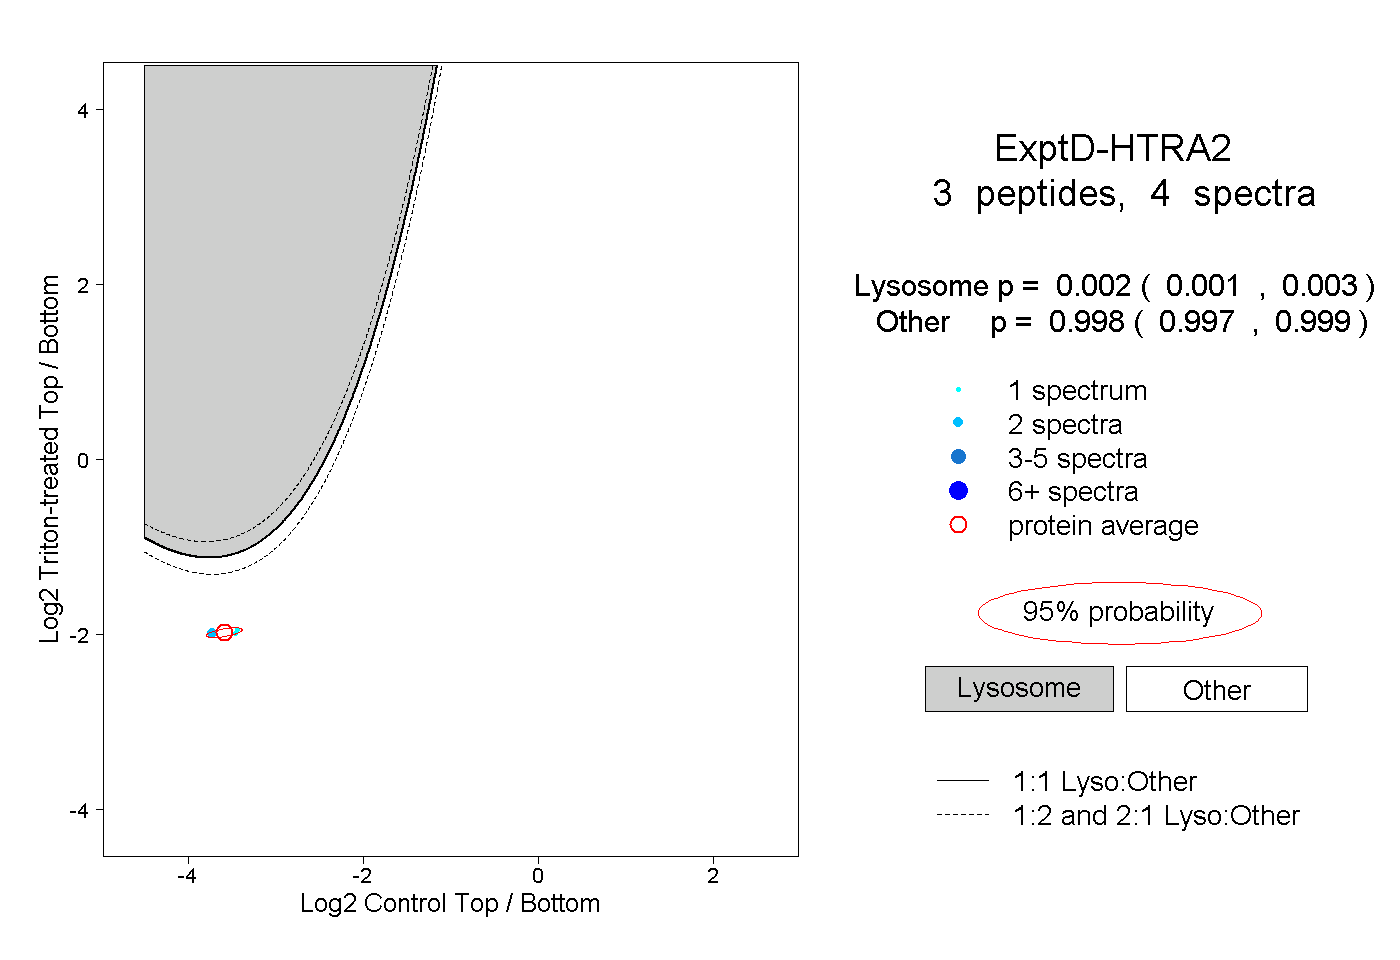
7peptides
spectra
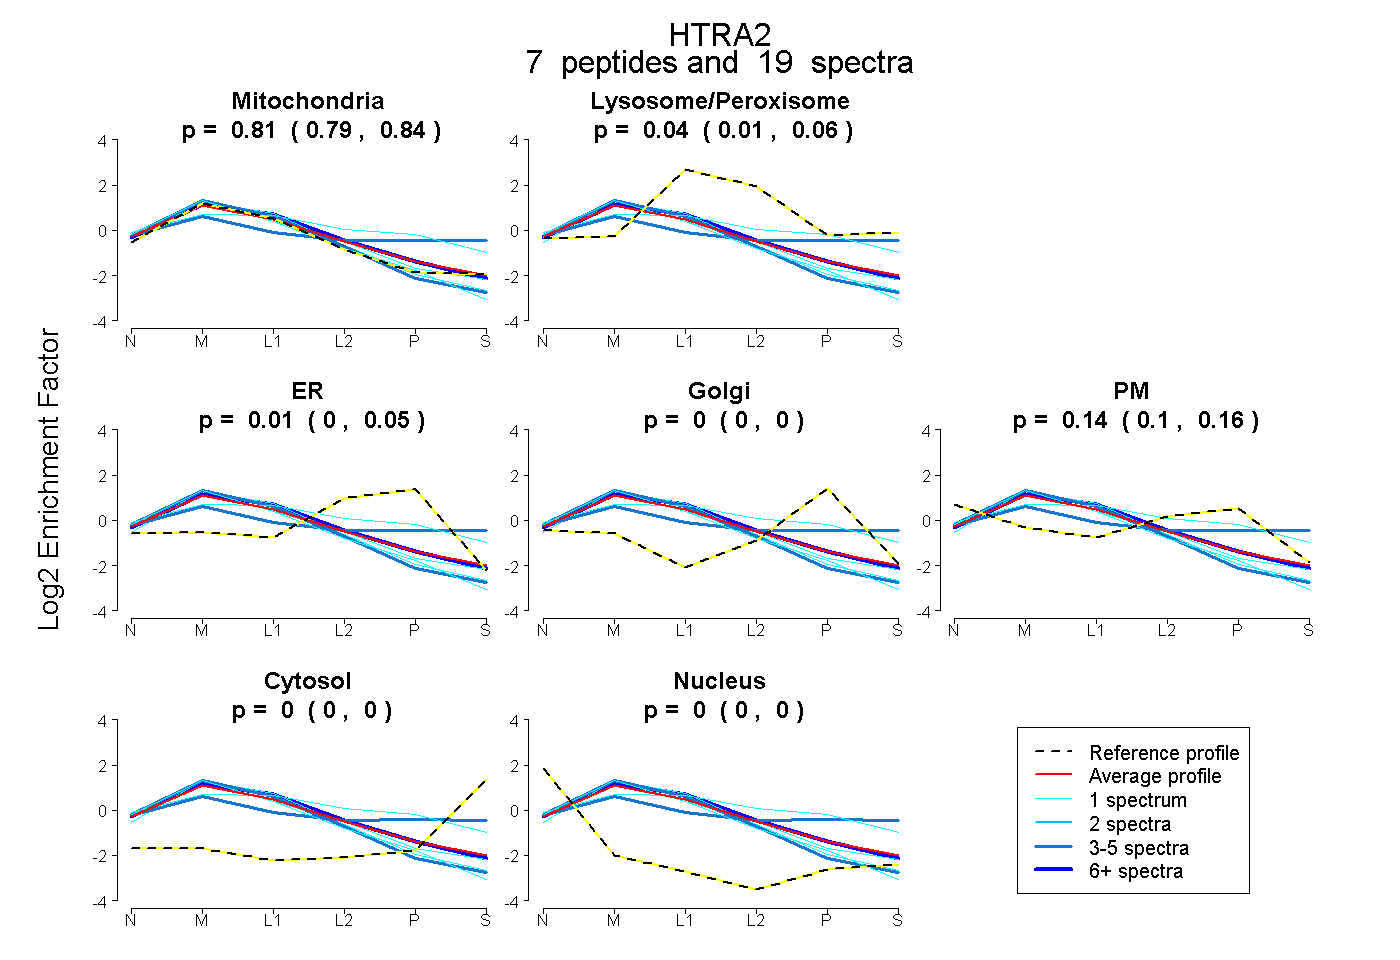
0.786 | 0.840
0.010 | 0.055
0.000 | 0.045
0.000 | 0.000
0.103 | 0.155
0.000 | 0.000
0.000 | 0.000