 10
10peptides
spectra
0.719 | 0.731
0.000 | 0.000
0.062 | 0.076
0.000 | 0.000
0.000 | 0.000
0.196 | 0.213
0.000 | 0.000
0.000 | 0.000
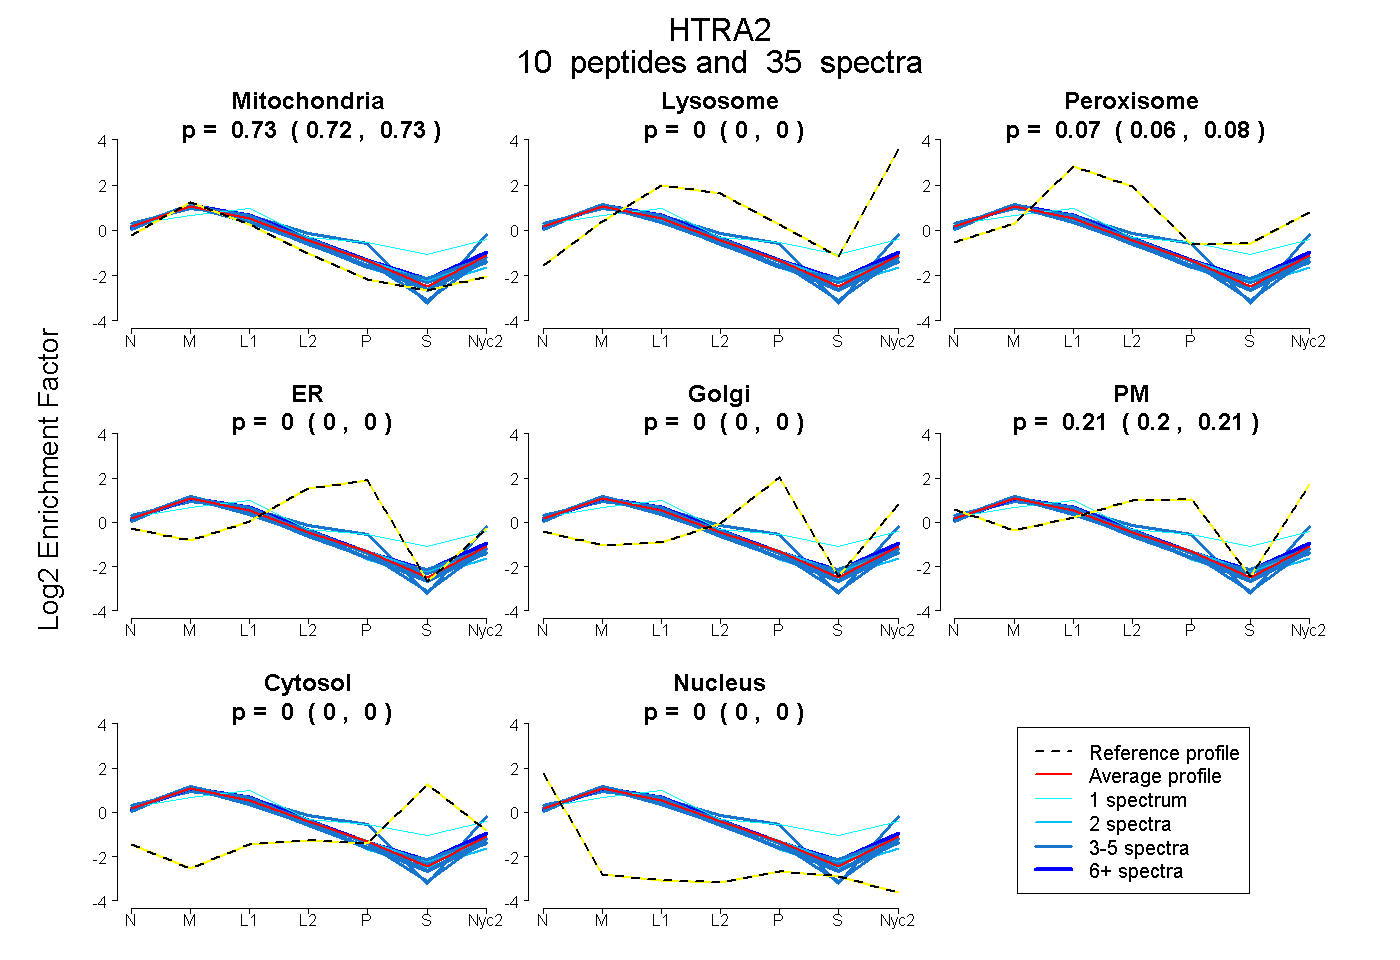
| Plot | Mito | Lyso | Perox | ER | Golgi | PM | Cytosol | Nucleus | |||||
| Expt A |
10 peptides |
35 spectra |
|
0.726 0.719 | 0.731 |
0.000 0.000 | 0.000 |
0.069 0.062 | 0.076 |
0.000 0.000 | 0.000 |
0.000 0.000 | 0.000 |
0.205 0.196 | 0.213 |
0.000 0.000 | 0.000 |
0.000 0.000 | 0.000 |
| 4 spectra, NSWFGISGSQR | 0.768 | 0.000 | 0.000 | 0.000 | 0.000 | 0.232 | 0.000 | 0.000 | ||
| 4 spectra, VTAGISFAIPSDR | 0.742 | 0.000 | 0.099 | 0.000 | 0.000 | 0.132 | 0.011 | 0.015 | ||
| 3 spectra, EPSFPDVQHGVLIHK | 0.537 | 0.000 | 0.000 | 0.000 | 0.000 | 0.463 | 0.000 | 0.000 | ||
| 3 spectra, TQSQLAVR | 0.767 | 0.000 | 0.017 | 0.001 | 0.000 | 0.215 | 0.000 | 0.000 | ||
| 1 spectrum, VILGSPAHR | 0.407 | 0.000 | 0.295 | 0.000 | 0.021 | 0.176 | 0.101 | 0.000 | ||
| 2 spectra, AGLRPADVILAIGEK | 0.815 | 0.000 | 0.083 | 0.039 | 0.000 | 0.063 | 0.000 | 0.000 | ||
| 8 spectra, MIQNAEDVYEAVR | 0.690 | 0.000 | 0.142 | 0.000 | 0.000 | 0.168 | 0.000 | 0.000 | ||
| 4 spectra, EPLPTLPLGR | 0.814 | 0.000 | 0.016 | 0.000 | 0.000 | 0.169 | 0.000 | 0.000 | ||
| 2 spectra, TAPAVVYIEILDR | 0.750 | 0.000 | 0.074 | 0.000 | 0.006 | 0.167 | 0.004 | 0.000 | ||
| 4 spectra, SQYNFIADVVEK | 0.765 | 0.000 | 0.122 | 0.000 | 0.000 | 0.104 | 0.000 | 0.010 |
| Plot | Mito | Lyso or Perox | ER | Golgi | PM | Cytosol | Nucleus | ||||||
| Expt B |
7 peptides |
19 spectra |
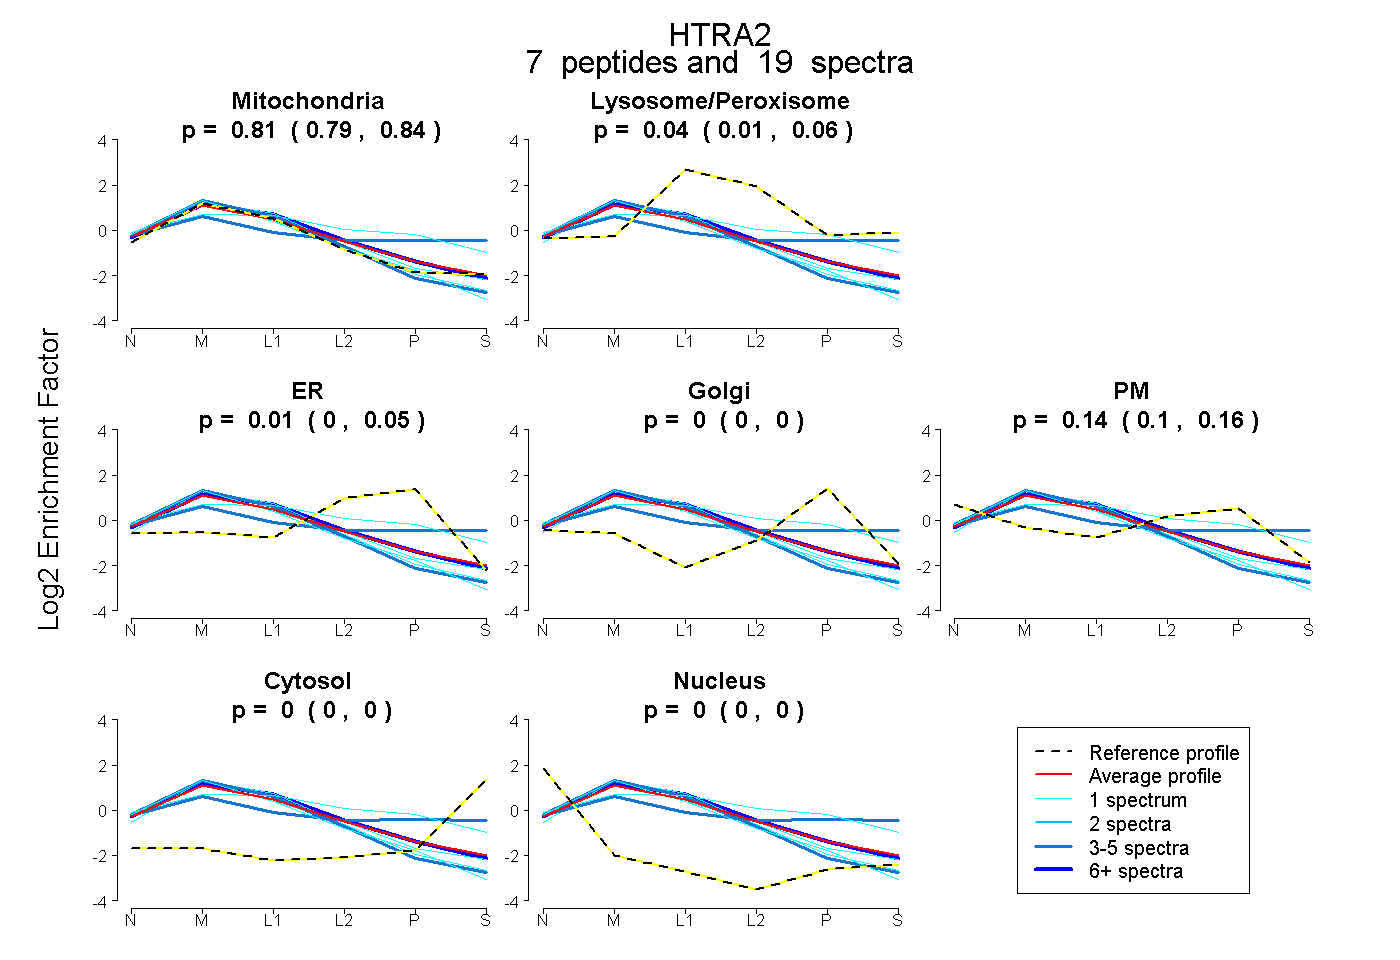 |
0.814 0.786 | 0.840 |
0.036 0.010 | 0.055 |
0.009 0.000 | 0.045 |
0.000 0.000 | 0.000 |
0.140 0.103 | 0.155 |
0.000 0.000 | 0.000 |
0.000 0.000 | 0.000 |
|||
| Plot | Lyso | Other | |||||||||||
| Expt C |
10 peptides |
69 spectra |
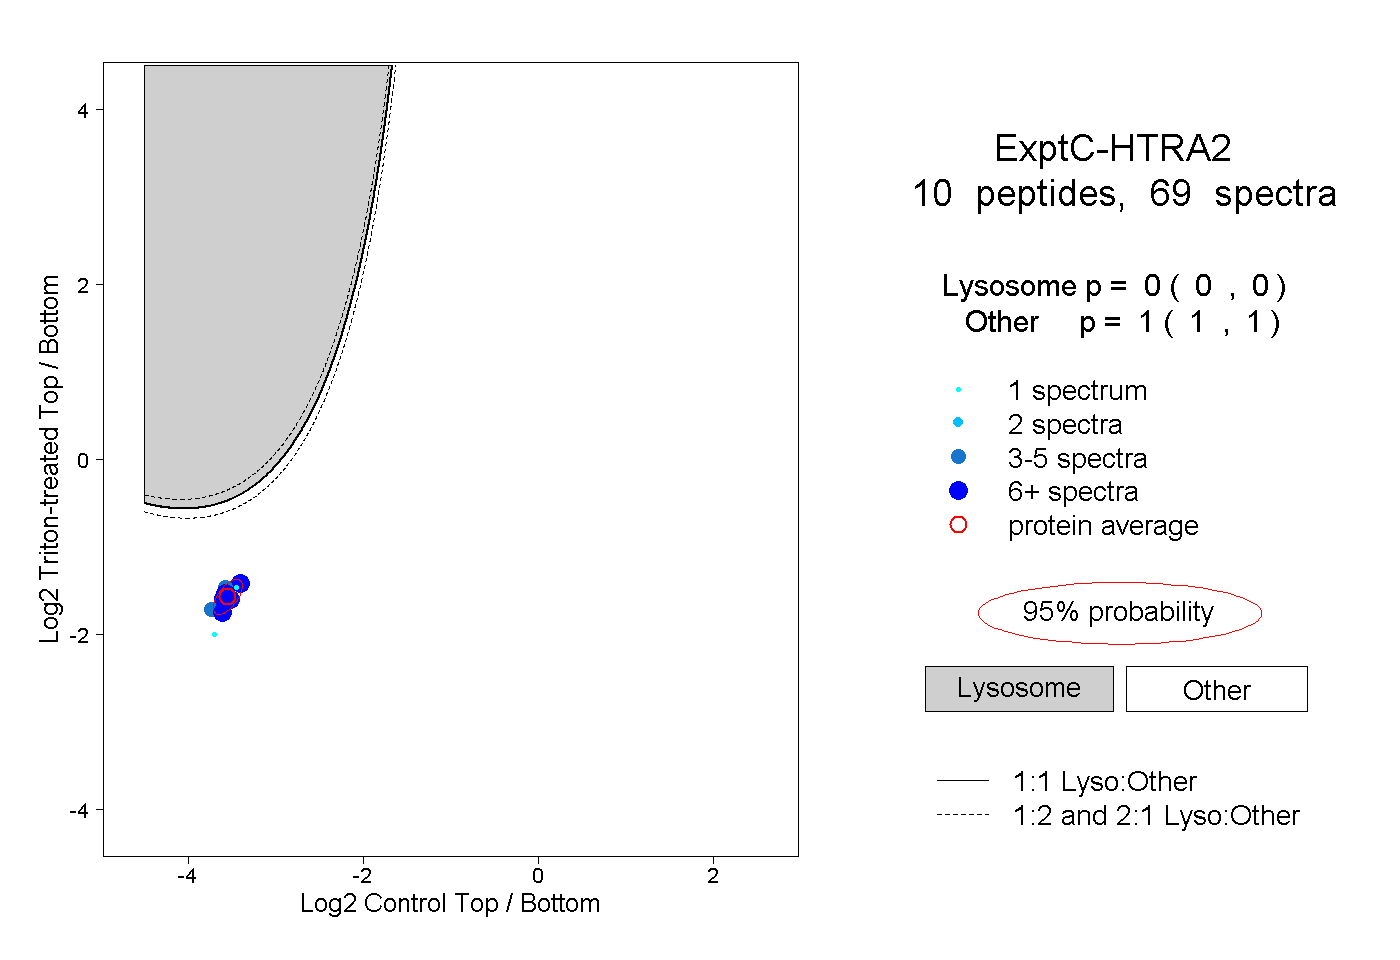 |
0.000 0.000 | 0.000 |
1.000 1.000 | 1.000 |
||||||||
| Plot | Lyso | Other | |||||||||||
| Expt D |
3 peptides |
4 spectra |
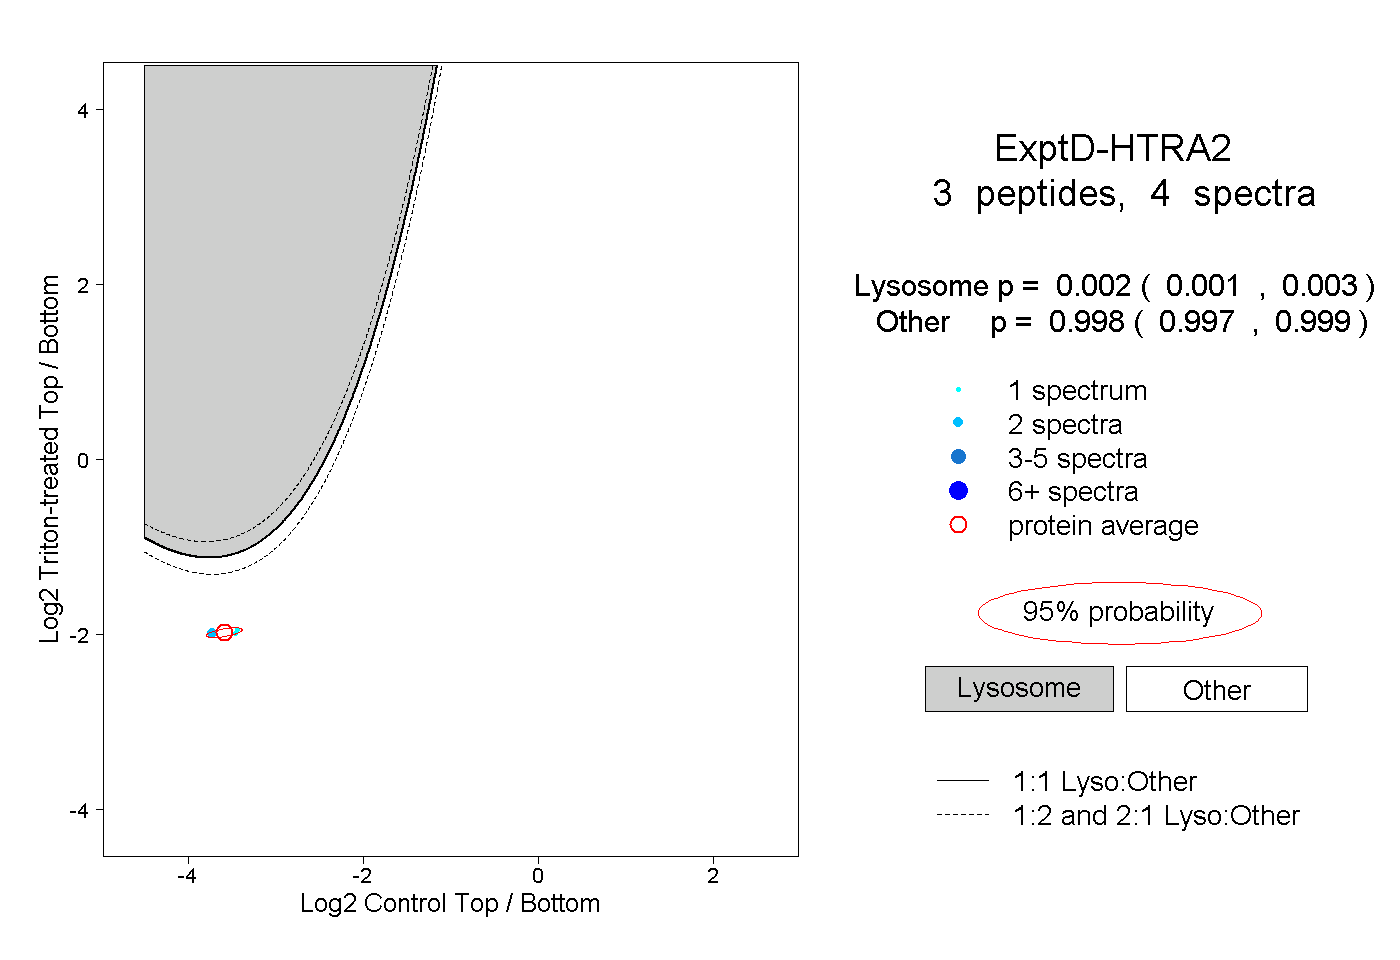 |
0.002 0.001 | 0.003 |
0.998 0.997 | 0.999 |