 2
2peptides
spectra
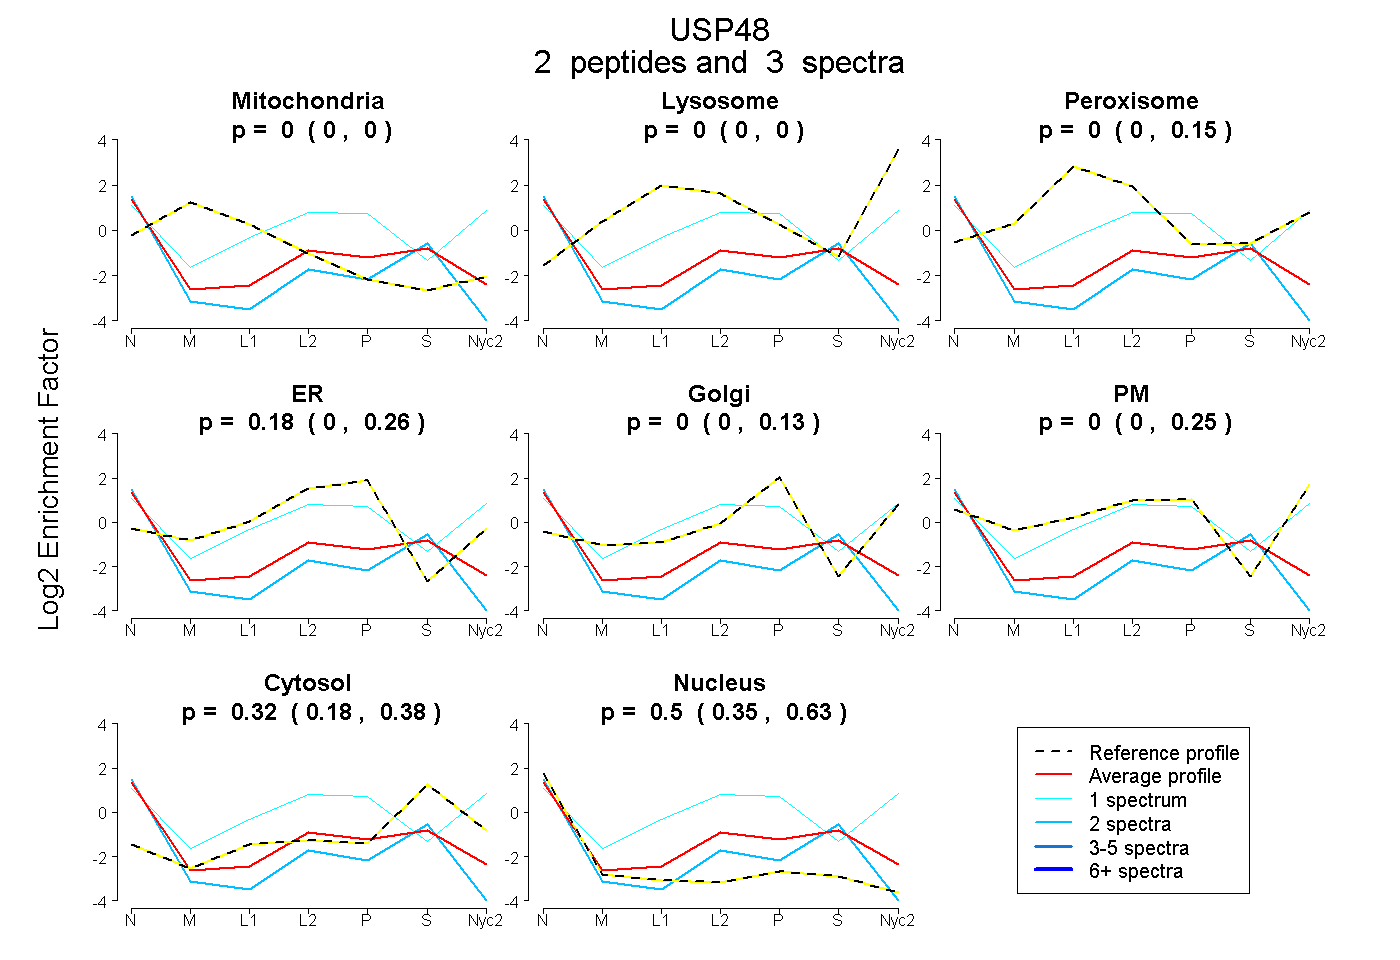
0.000 | 0.000
0.000 | 0.000
0.000 | 0.151
0.000 | 0.264
0.000 | 0.132
0.000 | 0.249
0.180 | 0.378
0.355 | 0.631
1peptide
spectrum
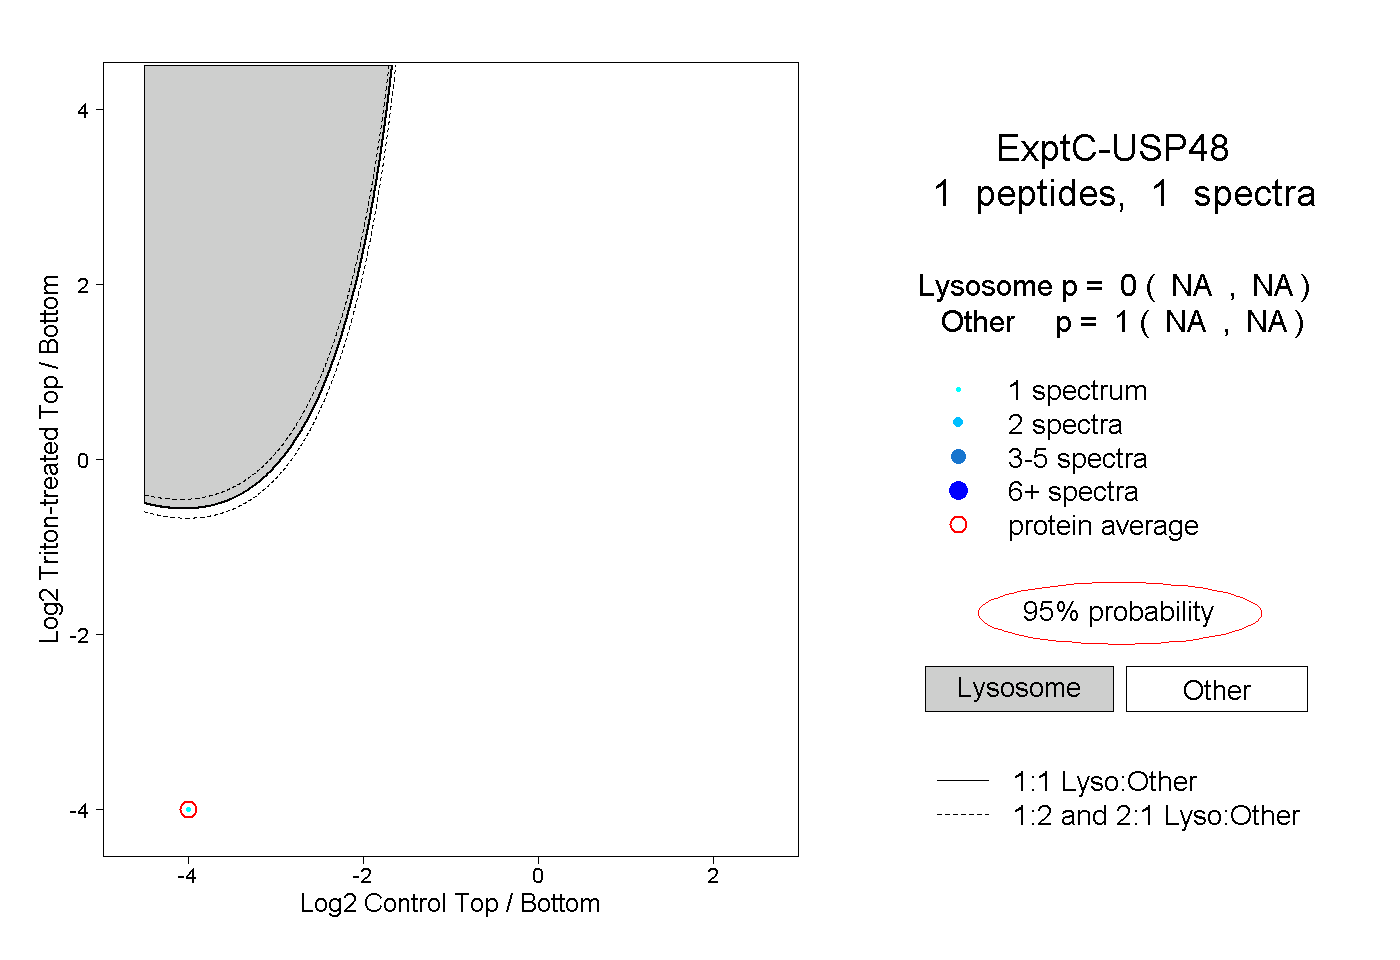
NA | NA
NA | NA
| Plot | Mito | Lyso | Perox | ER | Golgi | PM | Cytosol | Nucleus | |||||
| Expt A |
2 peptides |
3 spectra |
|
0.000 0.000 | 0.000 |
0.000 0.000 | 0.000 |
0.000 0.000 | 0.151 |
0.183 0.000 | 0.264 |
0.000 0.000 | 0.132 |
0.000 0.000 | 0.249 |
0.320 0.180 | 0.378 |
0.497 0.355 | 0.631 |
||
| Plot | Lyso | Other | |||||||||||
| Expt C |
1 peptide |
1 spectrum |
|
0.000 NA | NA |
1.000 NA | NA |