 6
6peptides
spectra

0.000 | 0.000
0.012 | 0.089
0.000 | 0.077
0.245 | 0.361
0.197 | 0.346
0.199 | 0.322
0.032 | 0.081
0.000 | 0.000
1peptide
spectrum
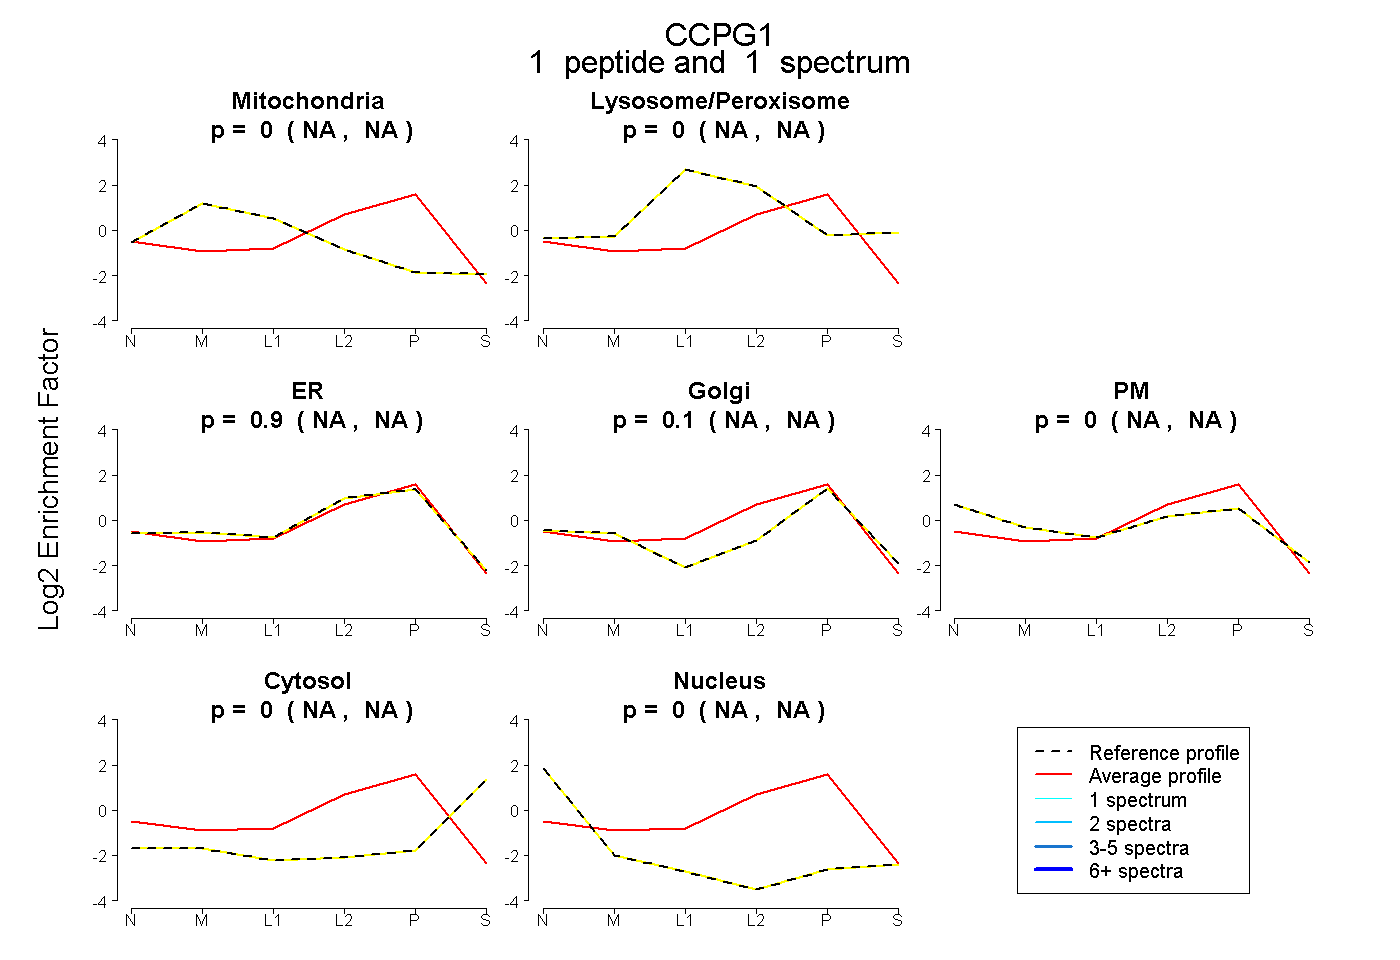
NA | NA
NA | NA
NA | NA
NA | NA
NA | NA
NA | NA
NA | NA
5peptides
spectra
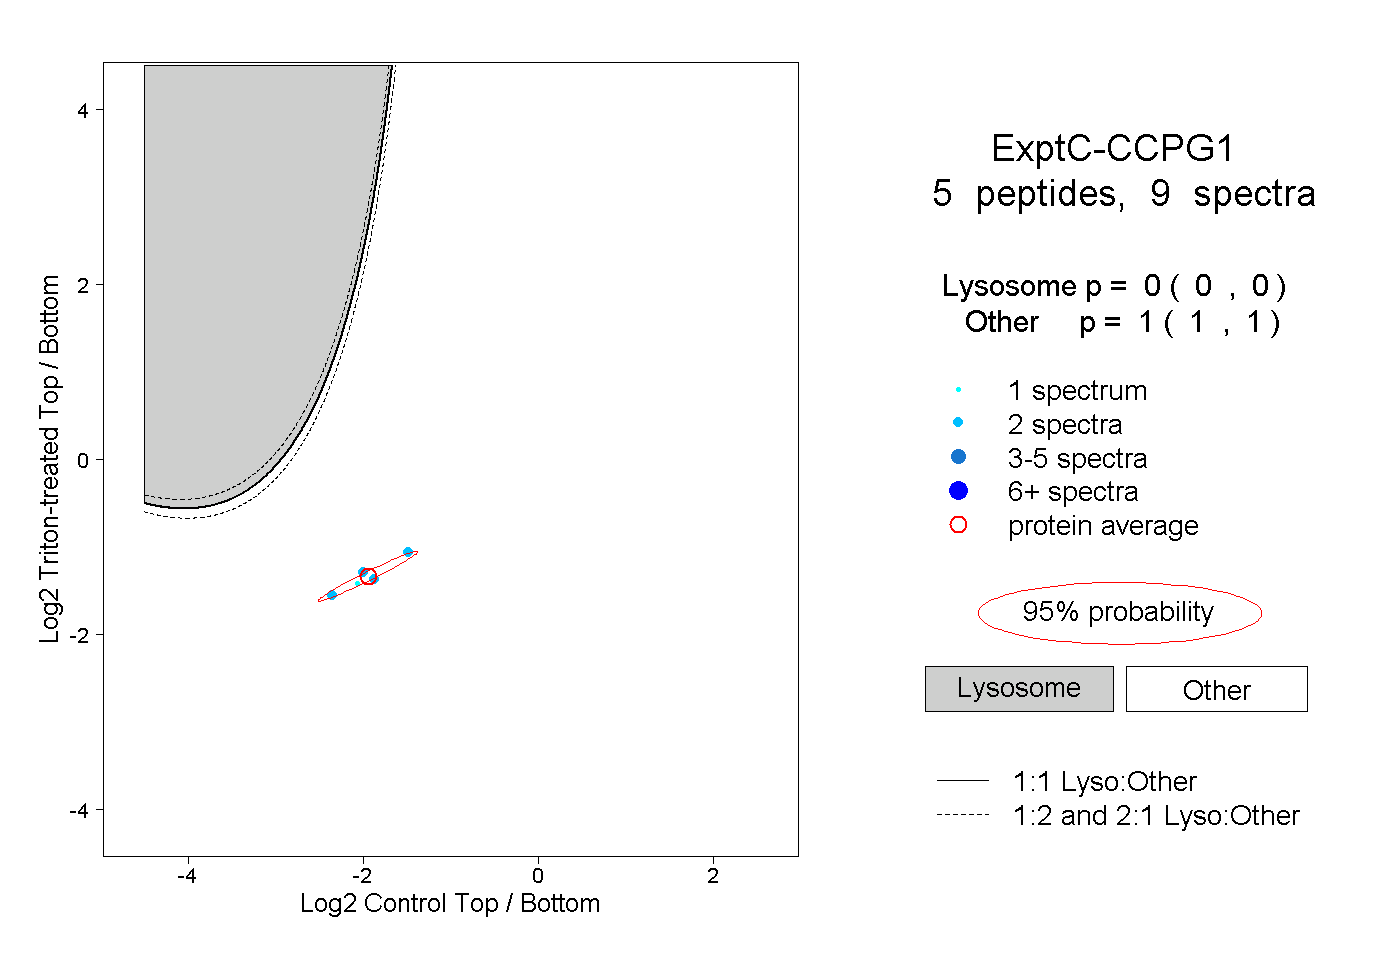
0.000 | 0.000
1.000 | 1.000