 4
4peptides
spectra
0.000 | 0.000
0.000 | 0.000
0.000 | 0.008
0.300 | 0.739
0.099 | 0.436
0.000 | 0.307
0.000 | 0.000
0.000 | 0.086
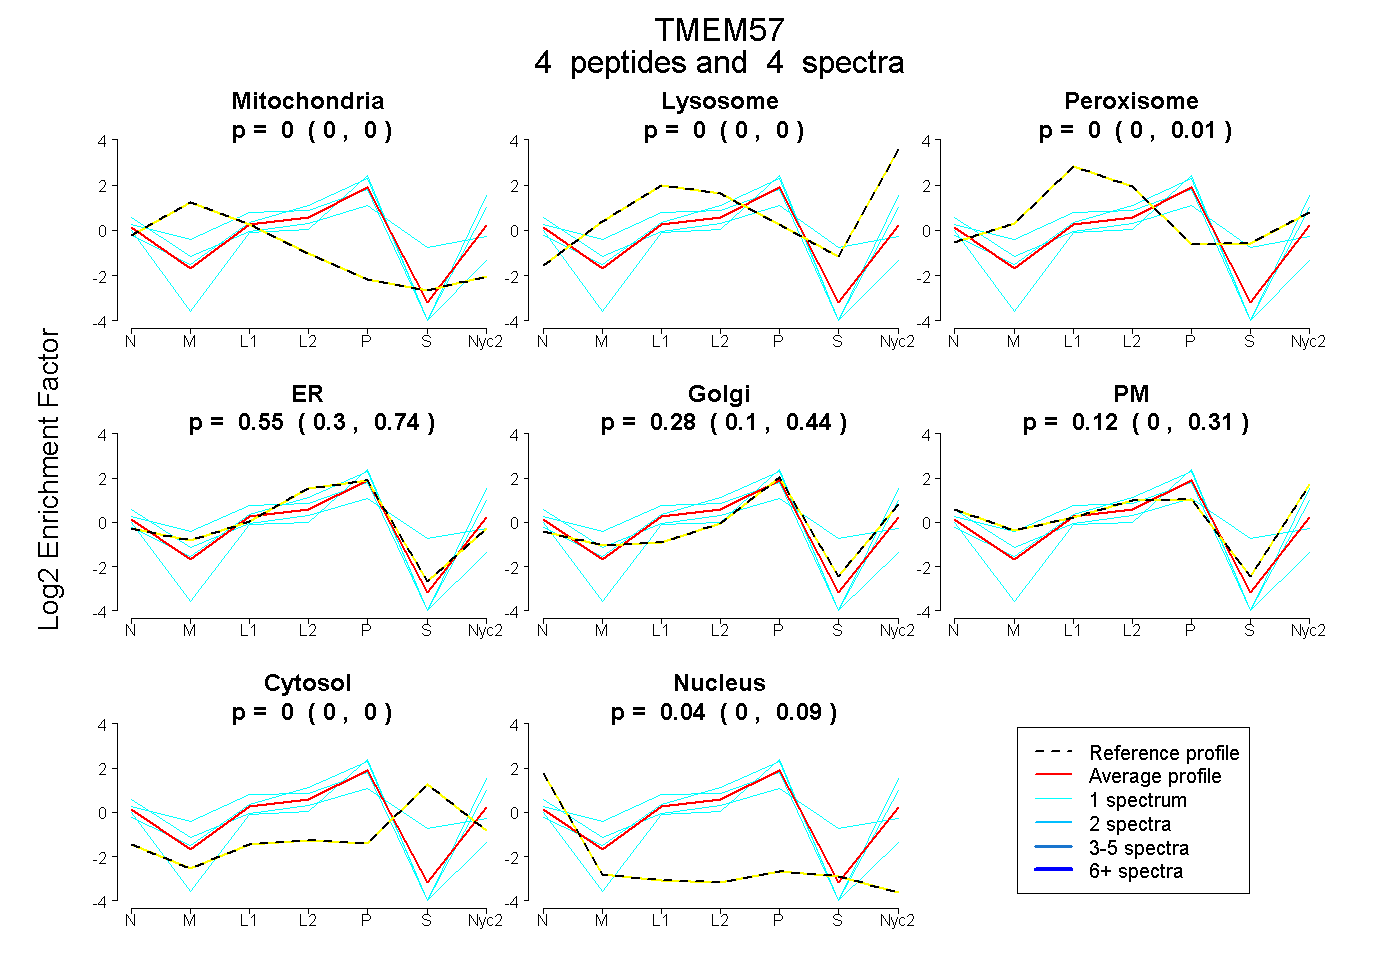
| Plot | Mito | Lyso | Perox | ER | Golgi | PM | Cytosol | Nucleus | |||||
| Expt A |
4 peptides |
4 spectra |
|
0.000 0.000 | 0.000 |
0.000 0.000 | 0.000 |
0.000 0.000 | 0.008 |
0.552 0.300 | 0.739 |
0.285 0.099 | 0.436 |
0.119 0.000 | 0.307 |
0.000 0.000 | 0.000 |
0.044 0.000 | 0.086 |
| 1 spectrum, SQISSLSSTER | 0.000 | 0.000 | 0.000 | 0.344 | 0.271 | 0.386 | 0.000 | 0.000 | ||
| 1 spectrum, LDLFSALGDAK | 0.000 | 0.000 | 0.000 | 0.417 | 0.000 | 0.583 | 0.000 | 0.000 | ||
| 1 spectrum, NASGVVNSSPR | 0.000 | 0.000 | 0.000 | 0.697 | 0.100 | 0.000 | 0.000 | 0.203 | ||
| 1 spectrum, SYVSYK | 0.000 | 0.000 | 0.051 | 0.386 | 0.000 | 0.254 | 0.274 | 0.036 |
| Plot | Mito | Lyso or Perox | ER | Golgi | PM | Cytosol | Nucleus | ||||||
| Expt B |
2 peptides |
2 spectra |
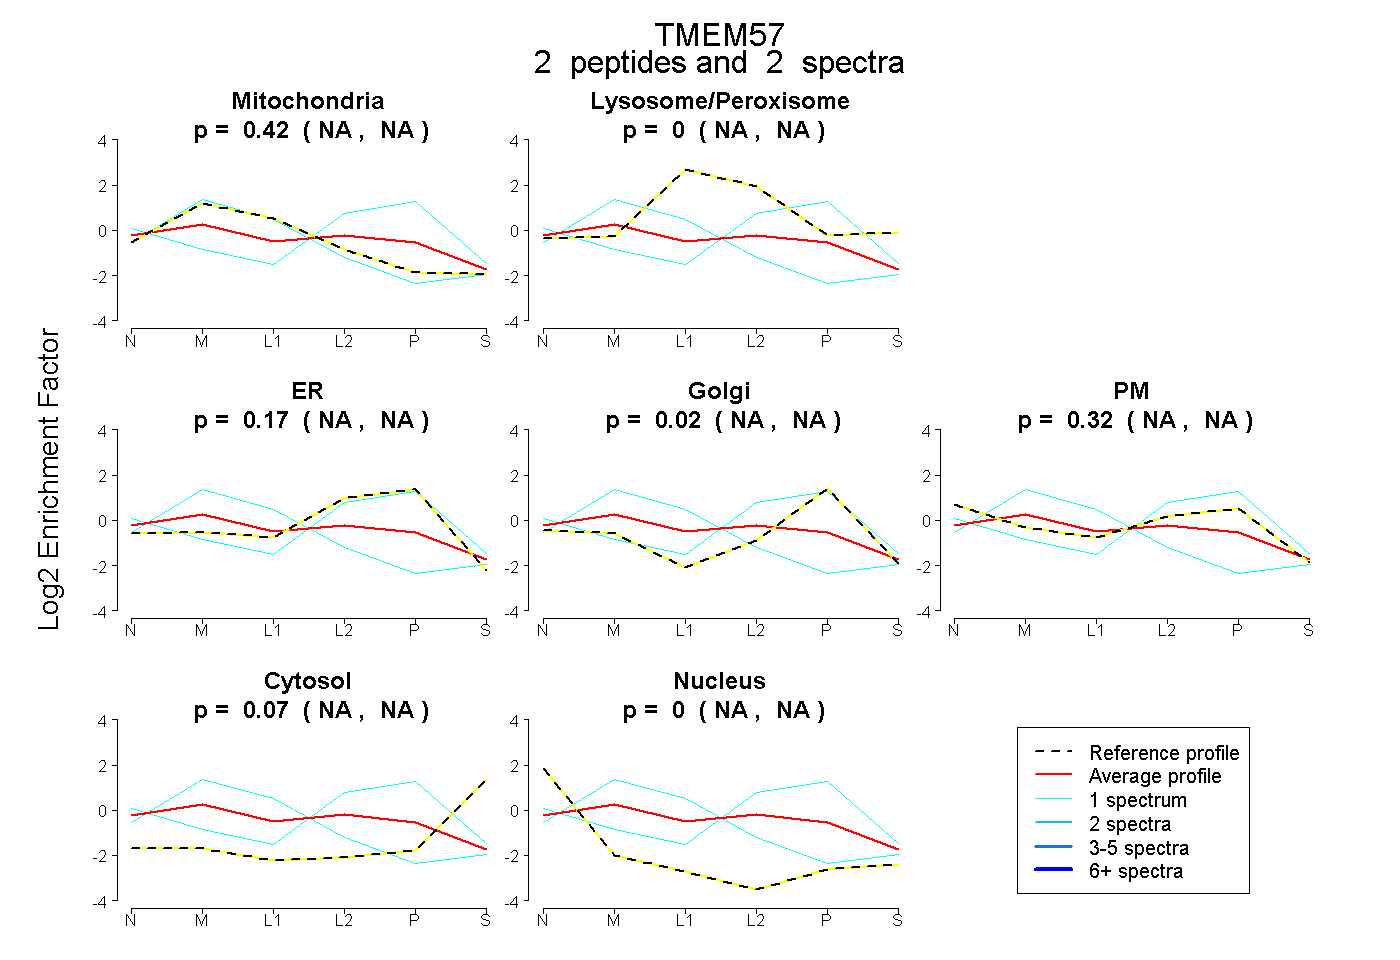 |
0.416 NA | NA |
0.000 NA | NA |
0.166 NA | NA |
0.019 NA | NA |
0.324 NA | NA |
0.074 NA | NA |
0.000 NA | NA |
|||
| Plot | Lyso | Other | |||||||||||
| Expt C |
4 peptides |
11 spectra |
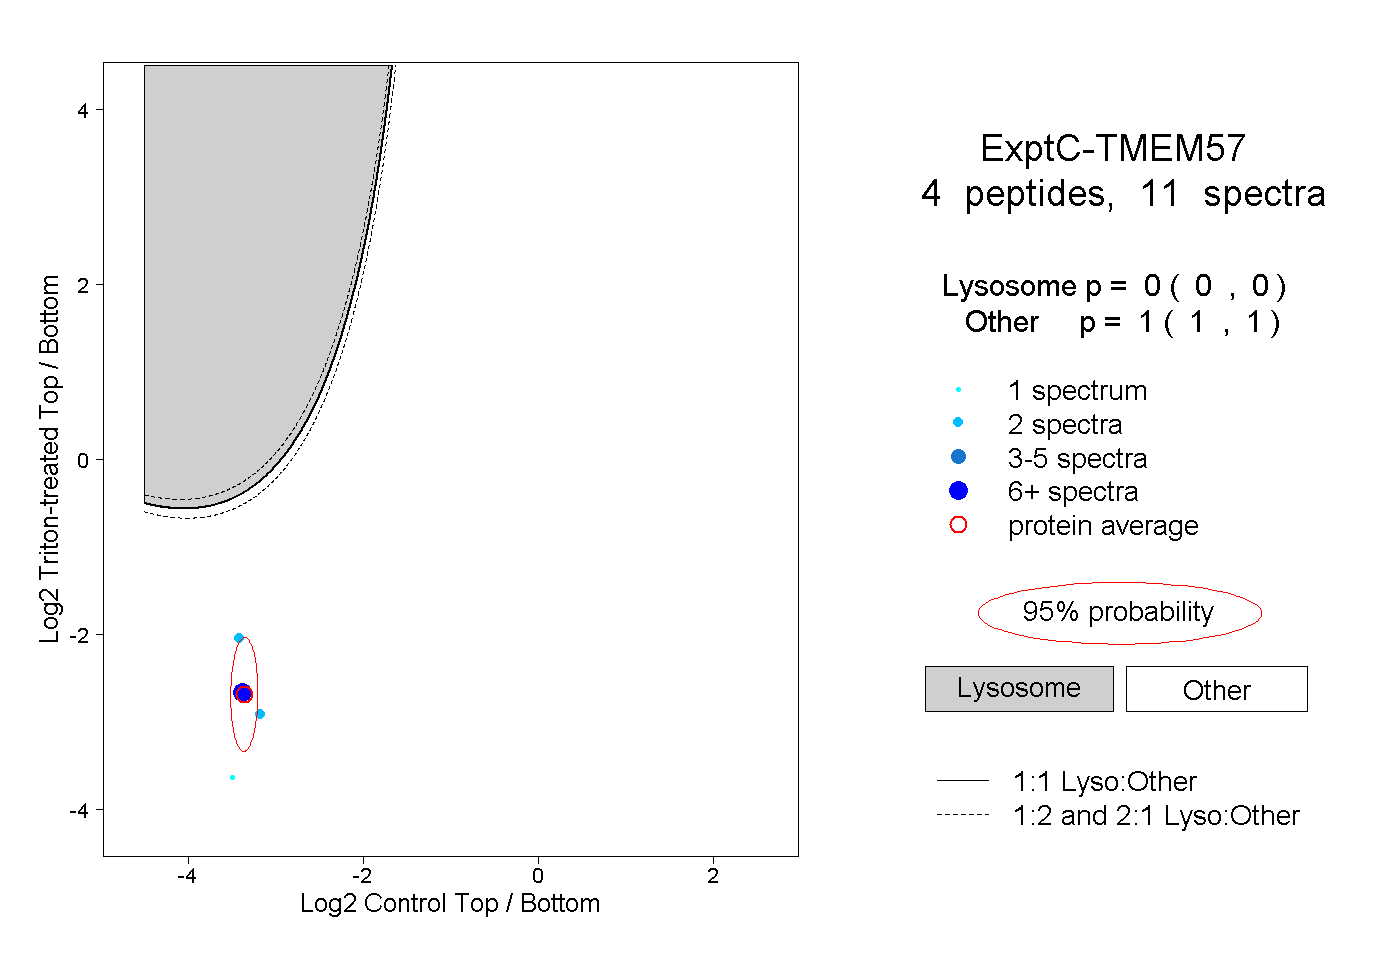 |
0.000 0.000 | 0.000 |
1.000 1.000 | 1.000 |
||||||||
| Plot | Lyso | Other | |||||||||||
| Expt D |
1 peptide |
1 spectrum |
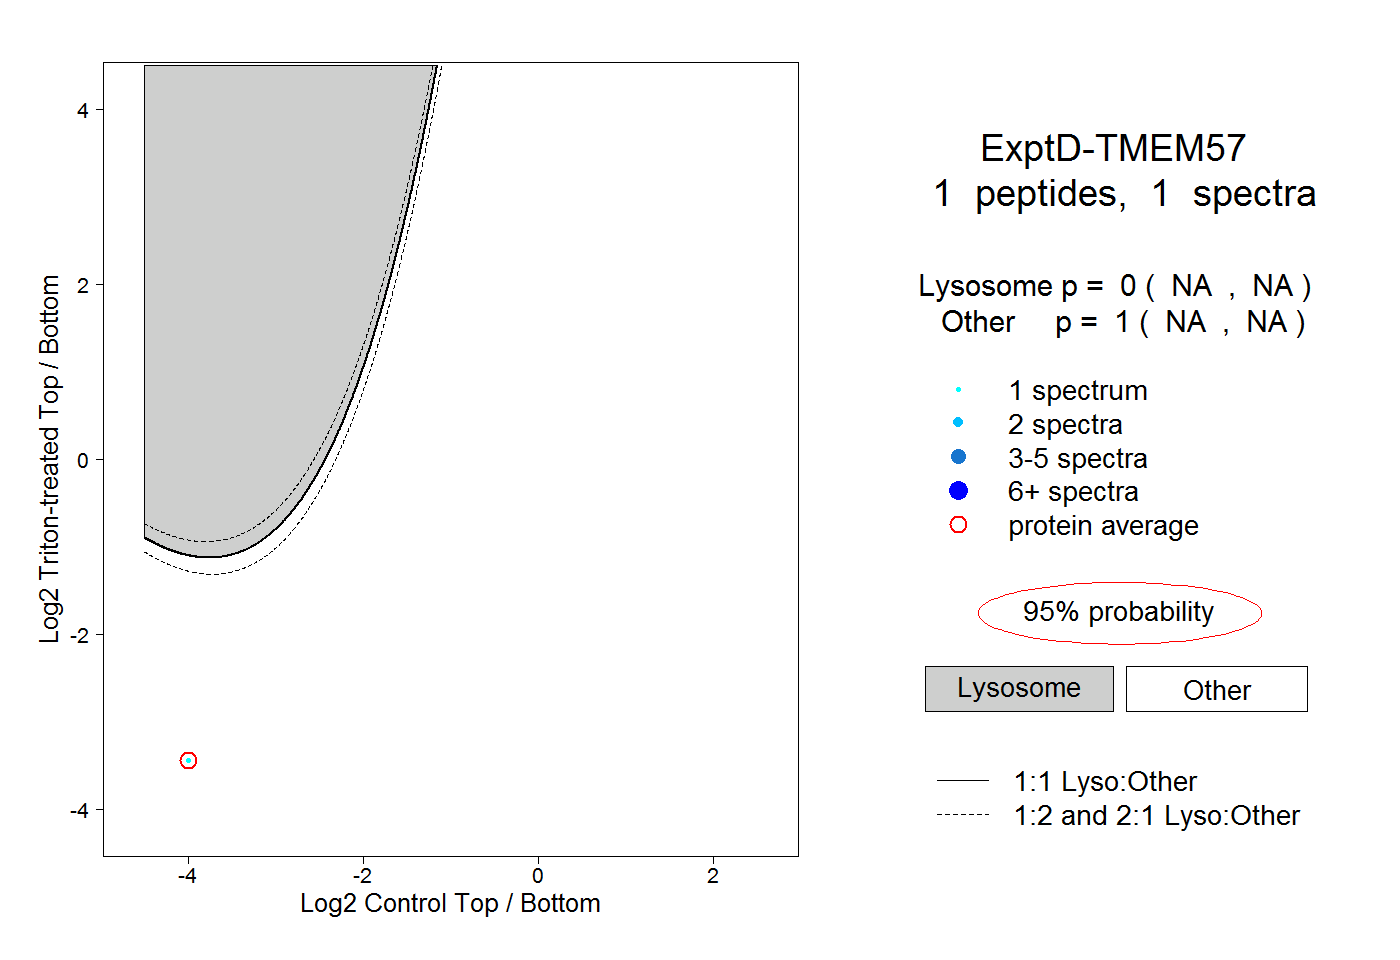 |
0.000 NA | NA |
1.000 NA | NA |