 7
7peptides
spectra
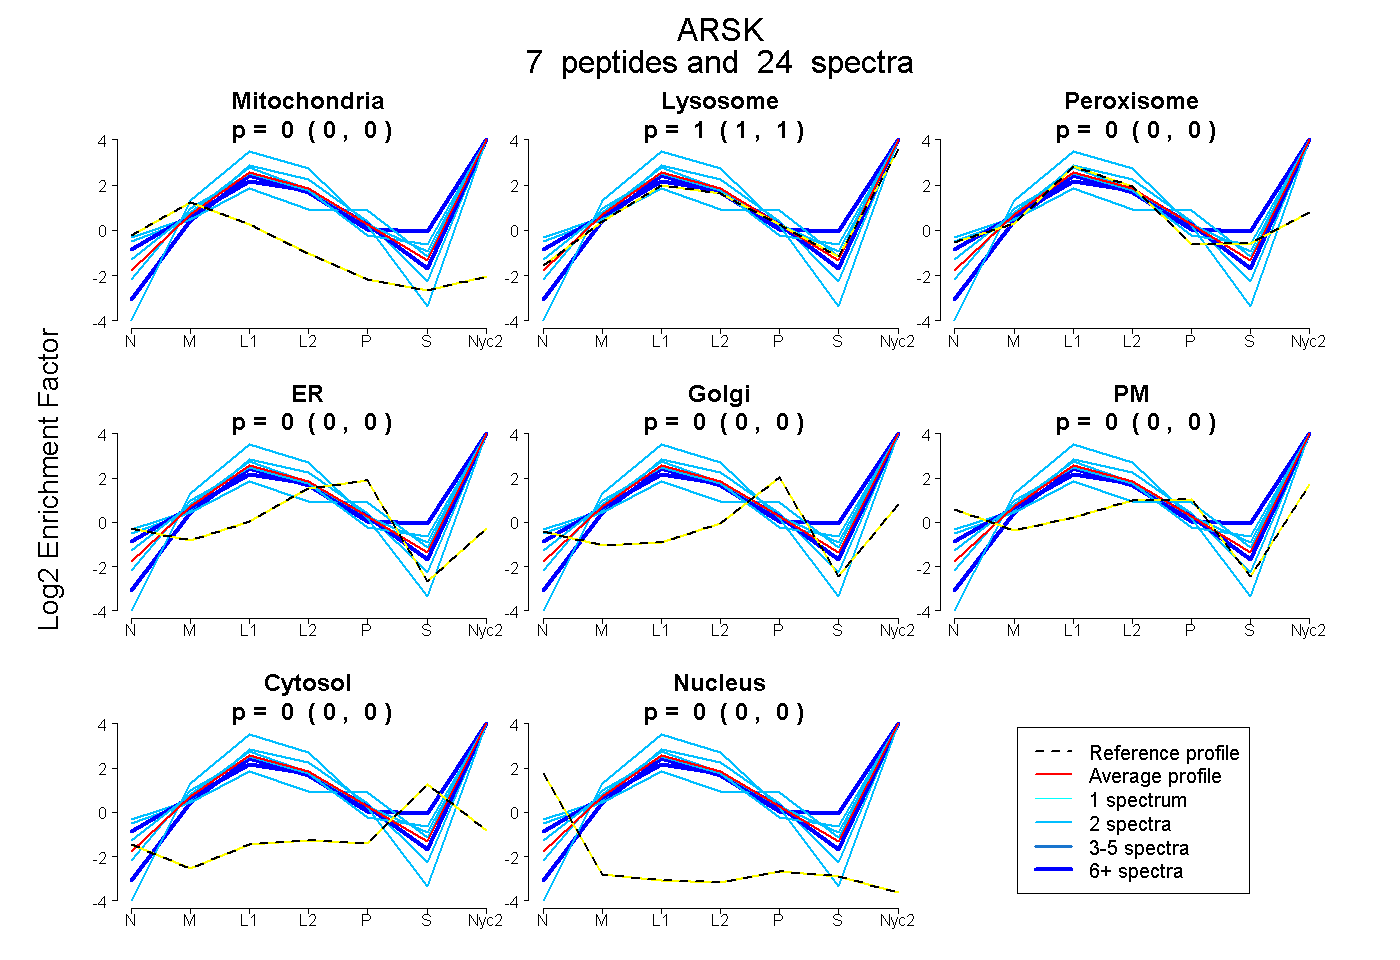
0.000 | 0.000
1.000 | 1.000
0.000 | 0.000
0.000 | 0.000
0.000 | 0.000
0.000 | 0.000
0.000 | 0.000
0.000 | 0.000
2peptides
spectra
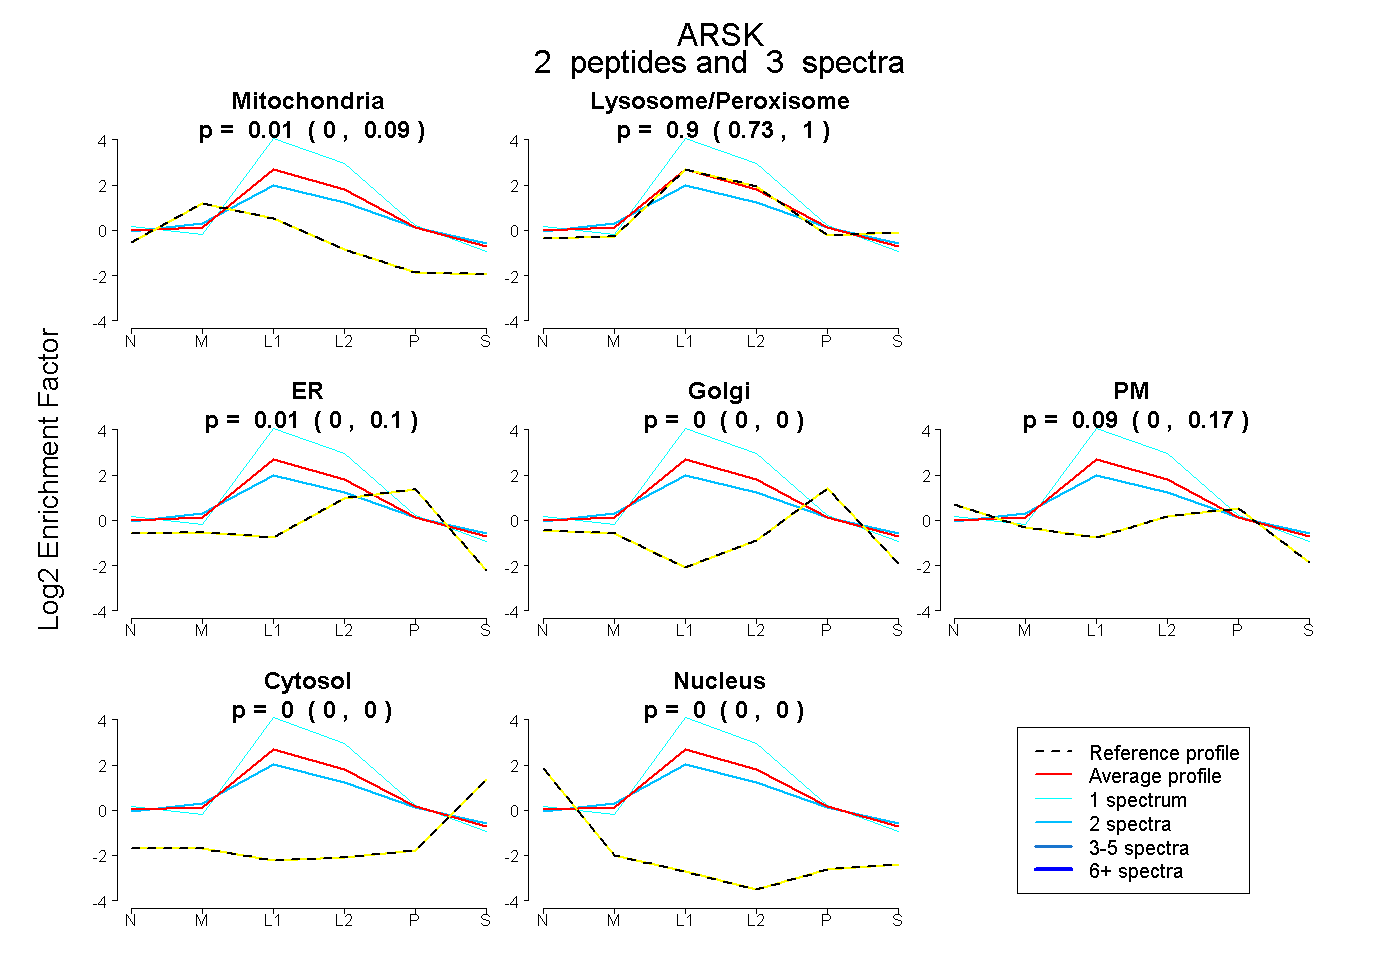
0.000 | 0.091
0.729 | 1.000
0.000 | 0.105
0.000 | 0.000
0.000 | 0.172
0.000 | 0.000
0.000 | 0.000
9peptides
spectra
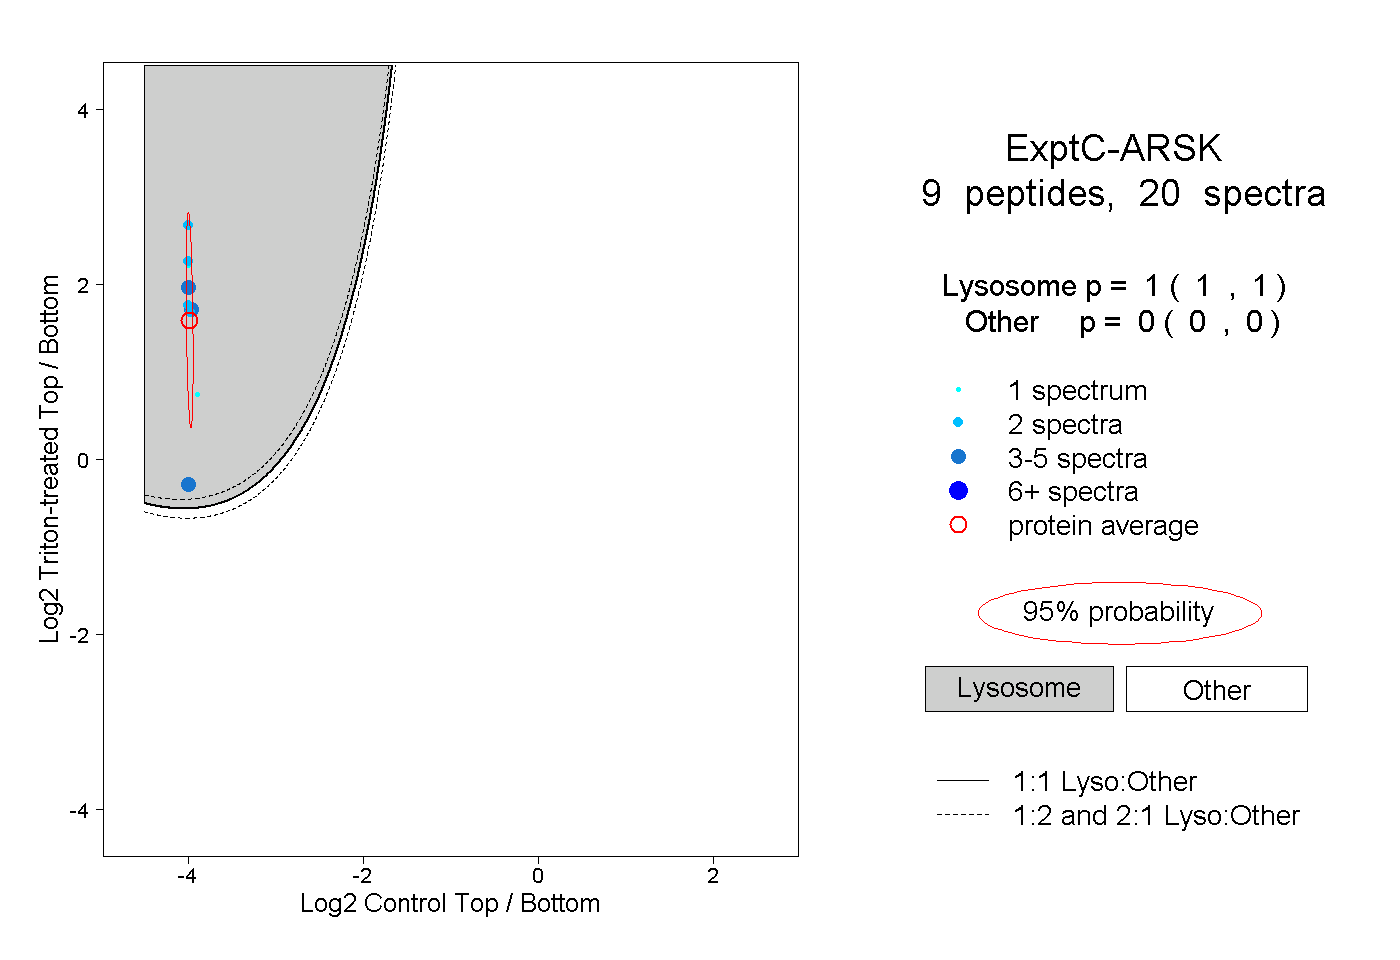
1.000 | 1.000
0.000 | 0.000
2peptides
spectra
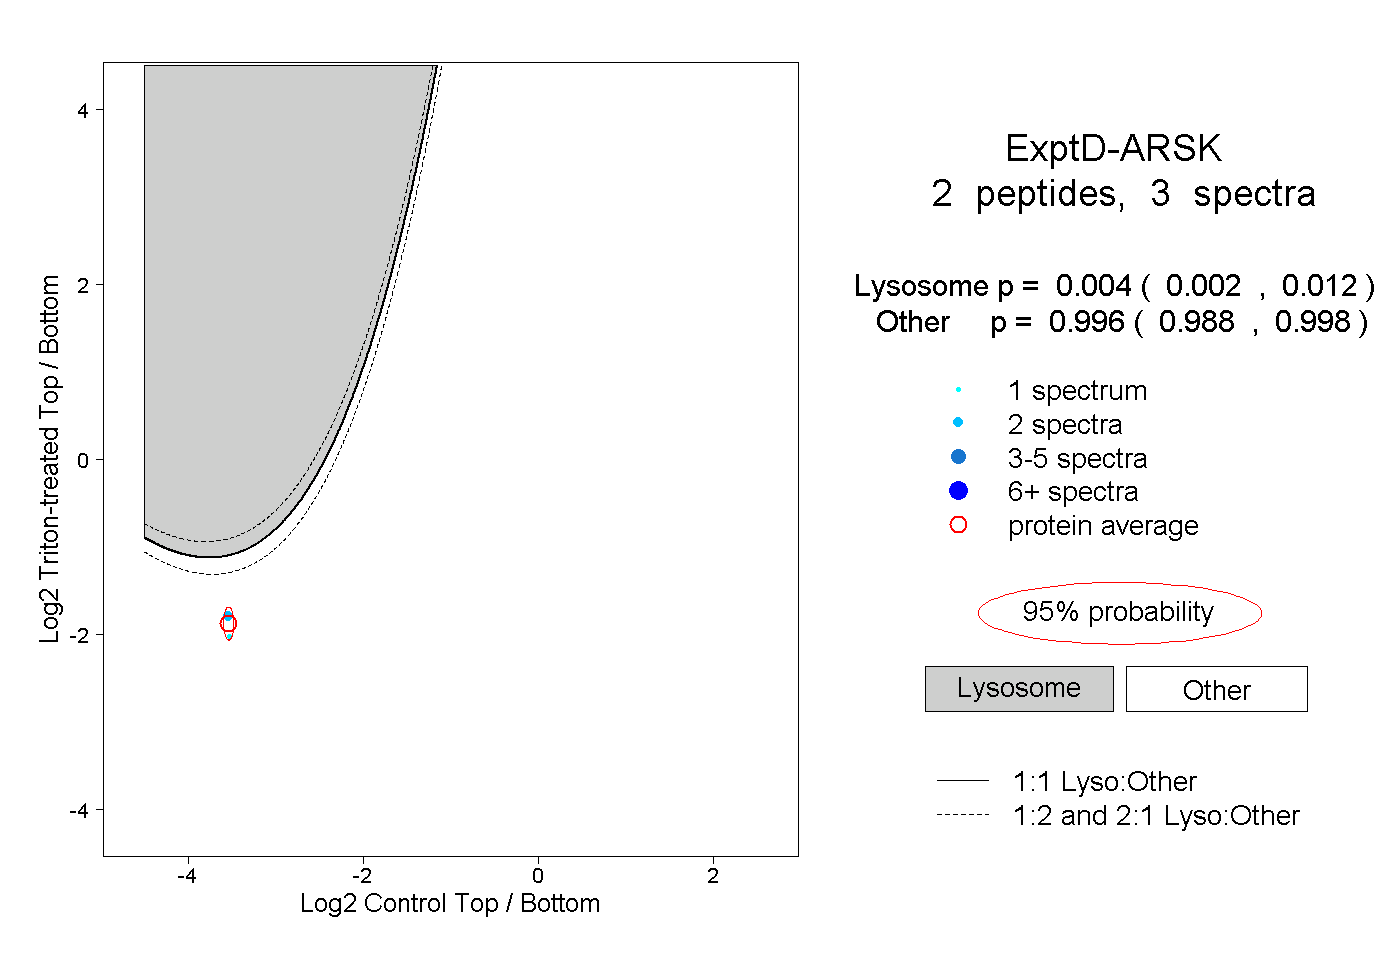
0.002 | 0.012
0.988 | 0.998