6
6peptides
spectra
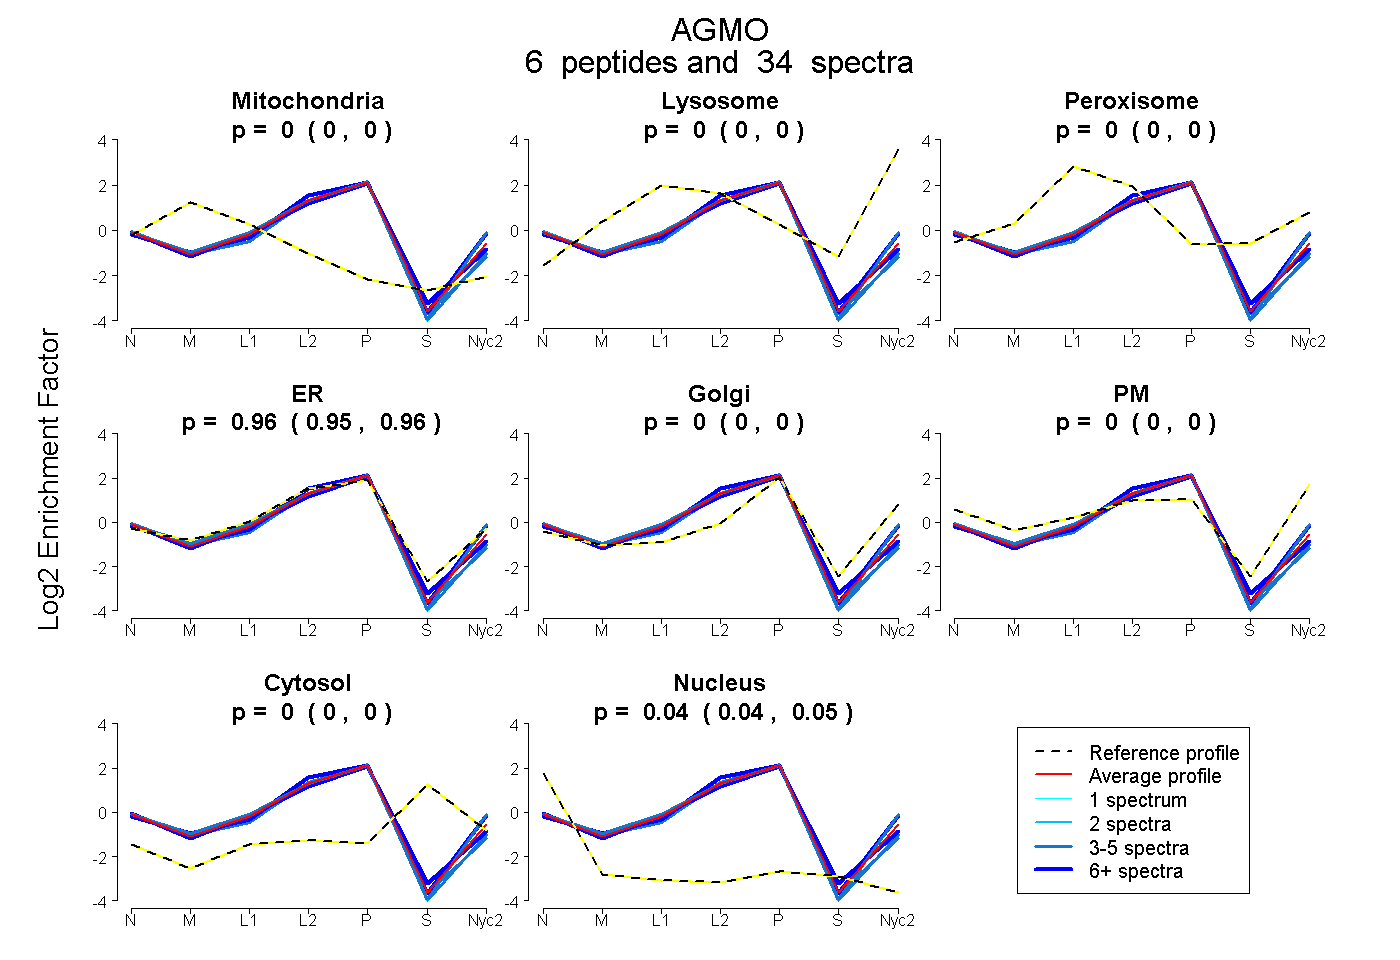
0.000 | 0.000
0.000 | 0.000
0.000 | 0.000
0.953 | 0.959
0.000 | 0.000
0.000 | 0.000
0.000 | 0.000
0.040 | 0.047
6peptides
spectra
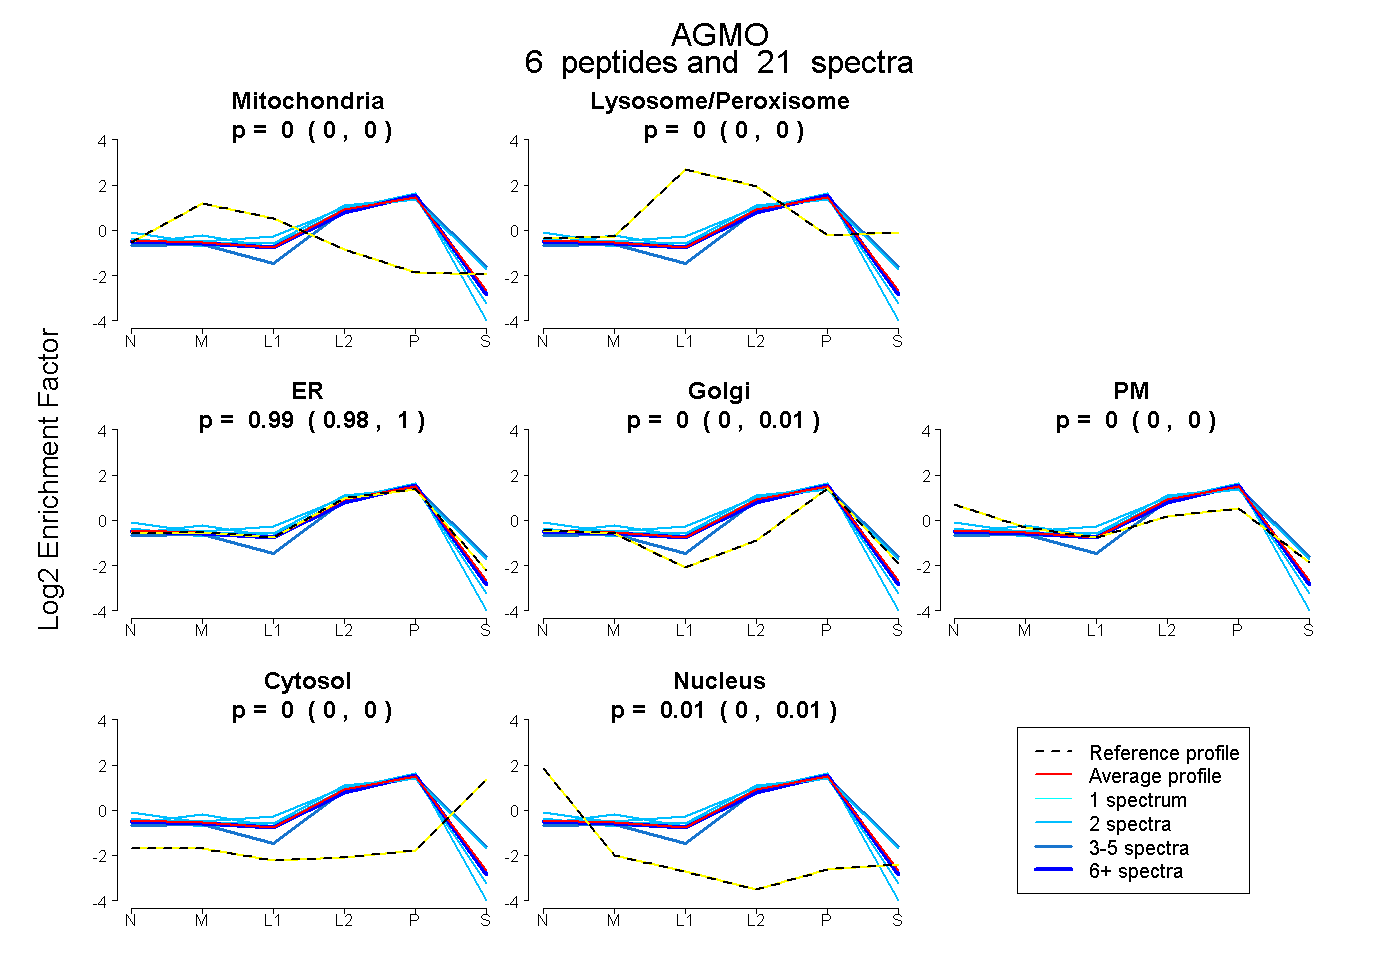
0.000 | 0.000
0.000 | 0.000
0.981 | 0.998
0.000 | 0.009
0.000 | 0.000
0.000 | 0.000
0.000 | 0.008