 6
6peptides
spectra
0.000 | 0.000
0.000 | 0.000
0.000 | 0.000
0.953 | 0.959
0.000 | 0.000
0.000 | 0.000
0.000 | 0.000
0.040 | 0.047
| Plot | Mito | Lyso | Perox | ER | Golgi | PM | Cytosol | Nucleus | |||||
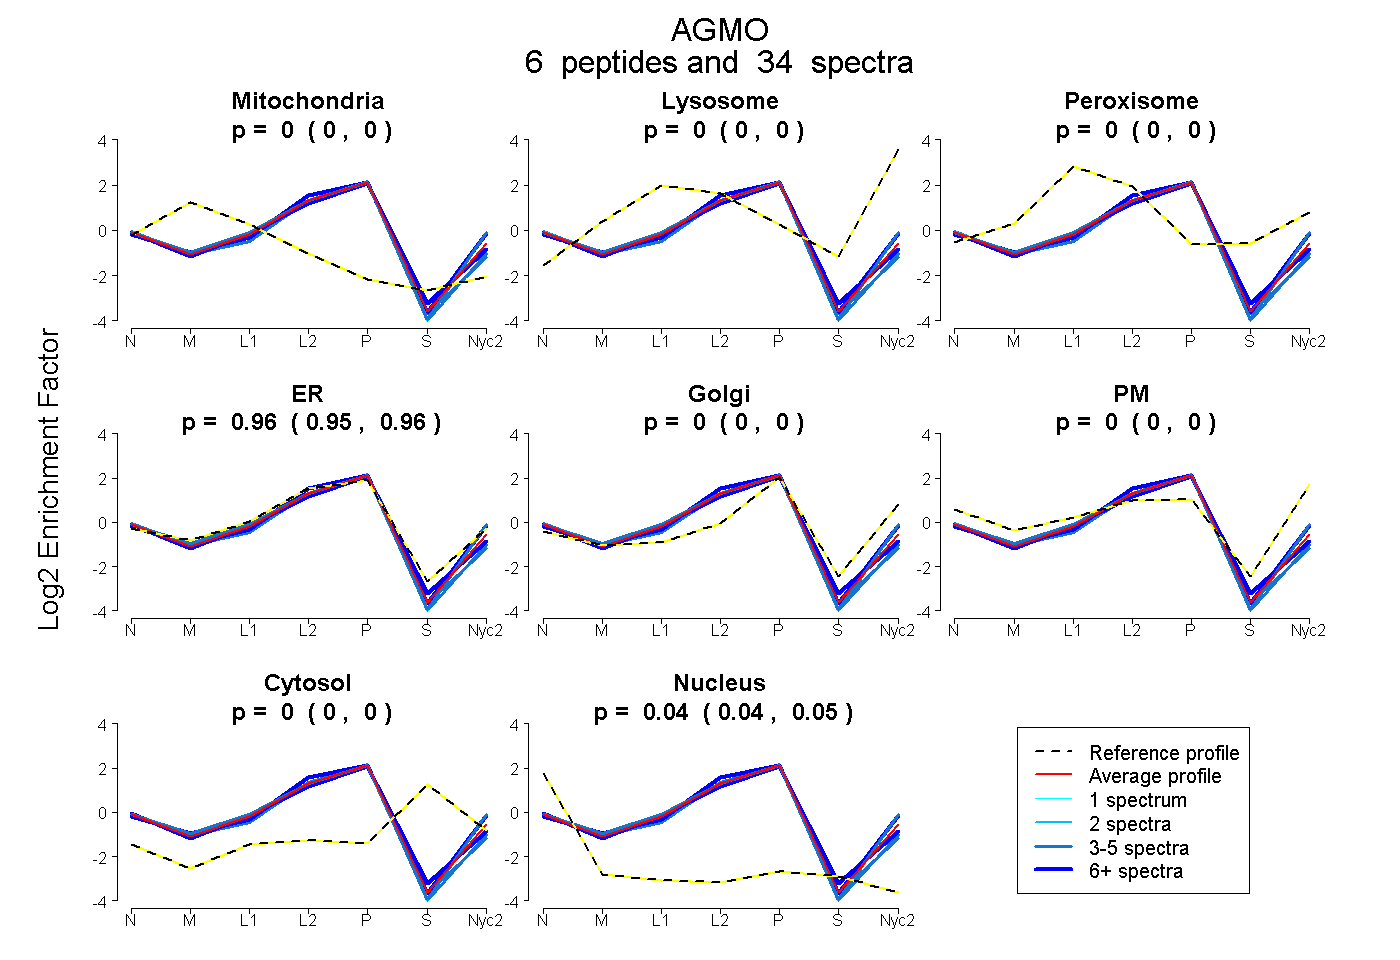
| Expt A |
6 peptides |
34 spectra |
|
0.000 0.000 | 0.000 |
0.000 0.000 | 0.000 |
0.000 0.000 | 0.000 |
0.956 0.953 | 0.959 |
0.000 0.000 | 0.000 |
0.000 0.000 | 0.000 |
0.000 0.000 | 0.000 |
0.044 0.040 | 0.047 |
| 6 spectra, LDDILTSMSAGVVSR | 0.000 | 0.000 | 0.000 | 0.930 | 0.070 | 0.000 | 0.000 | 0.000 | ||
| 3 spectra, FSVLFK | 0.000 | 0.000 | 0.000 | 0.916 | 0.000 | 0.000 | 0.000 | 0.084 | ||
| 4 spectra, NYAGTLIIWDR | 0.000 | 0.000 | 0.000 | 0.893 | 0.103 | 0.000 | 0.000 | 0.004 | ||
| 3 spectra, AAIVETLR | 0.000 | 0.000 | 0.000 | 0.929 | 0.000 | 0.000 | 0.000 | 0.071 | ||
| 2 spectra, LPNLFFR | 0.000 | 0.000 | 0.000 | 0.900 | 0.091 | 0.000 | 0.000 | 0.010 | ||
| 16 spectra, GPGWGPGKPR | 0.000 | 0.000 | 0.000 | 0.934 | 0.000 | 0.000 | 0.000 | 0.066 |
| Plot | Mito | Lyso or Perox | ER | Golgi | PM | Cytosol | Nucleus | ||||||
| Expt B |
6 peptides |
21 spectra |
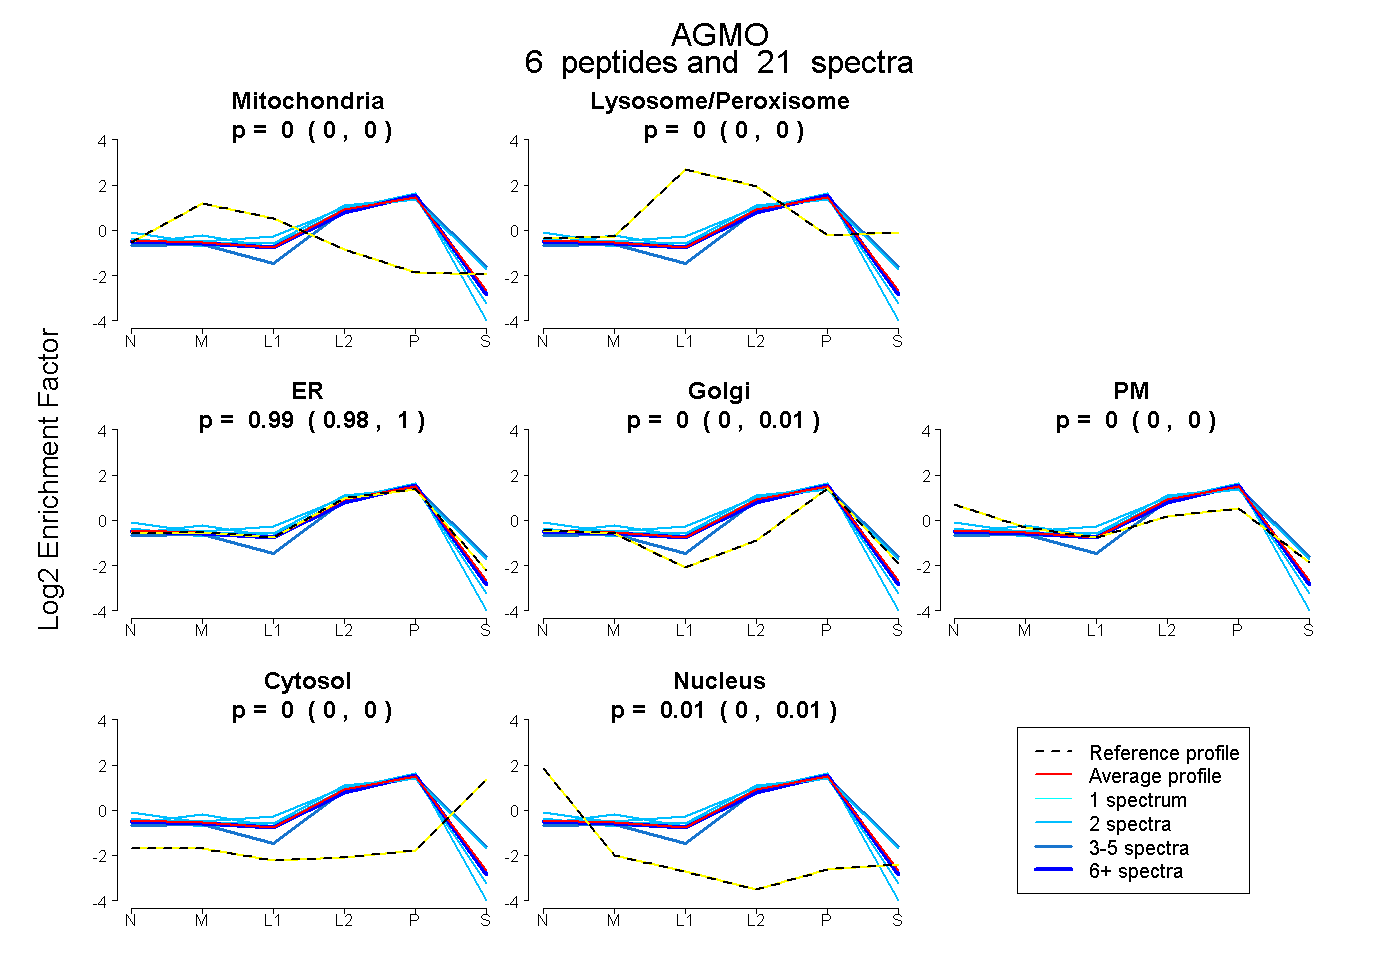 |
0.000 0.000 | 0.000 |
0.000 0.000 | 0.000 |
0.995 0.981 | 0.998 |
0.000 0.000 | 0.009 |
0.000 0.000 | 0.000 |
0.000 0.000 | 0.000 |
0.005 0.000 | 0.008 |
|||
| Plot | Lyso | Other | |||||||||||
| Expt C |
7 peptides |
63 spectra |
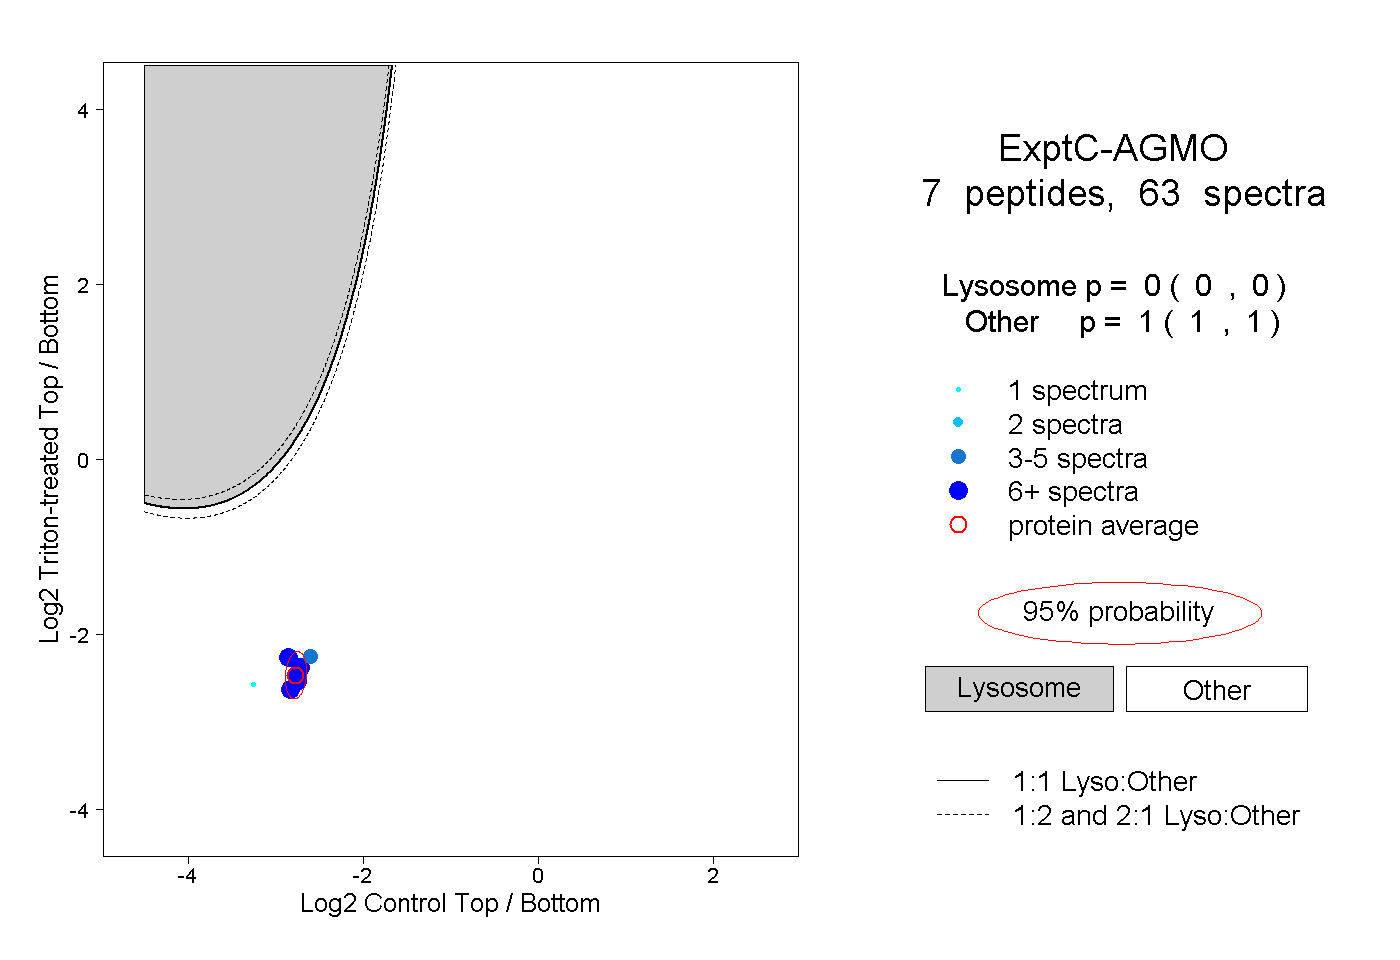 |
0.000 0.000 | 0.000 |
1.000 1.000 | 1.000 |
||||||||
| Plot | Lyso | Other | |||||||||||
| Expt D |
4 peptides |
8 spectra |
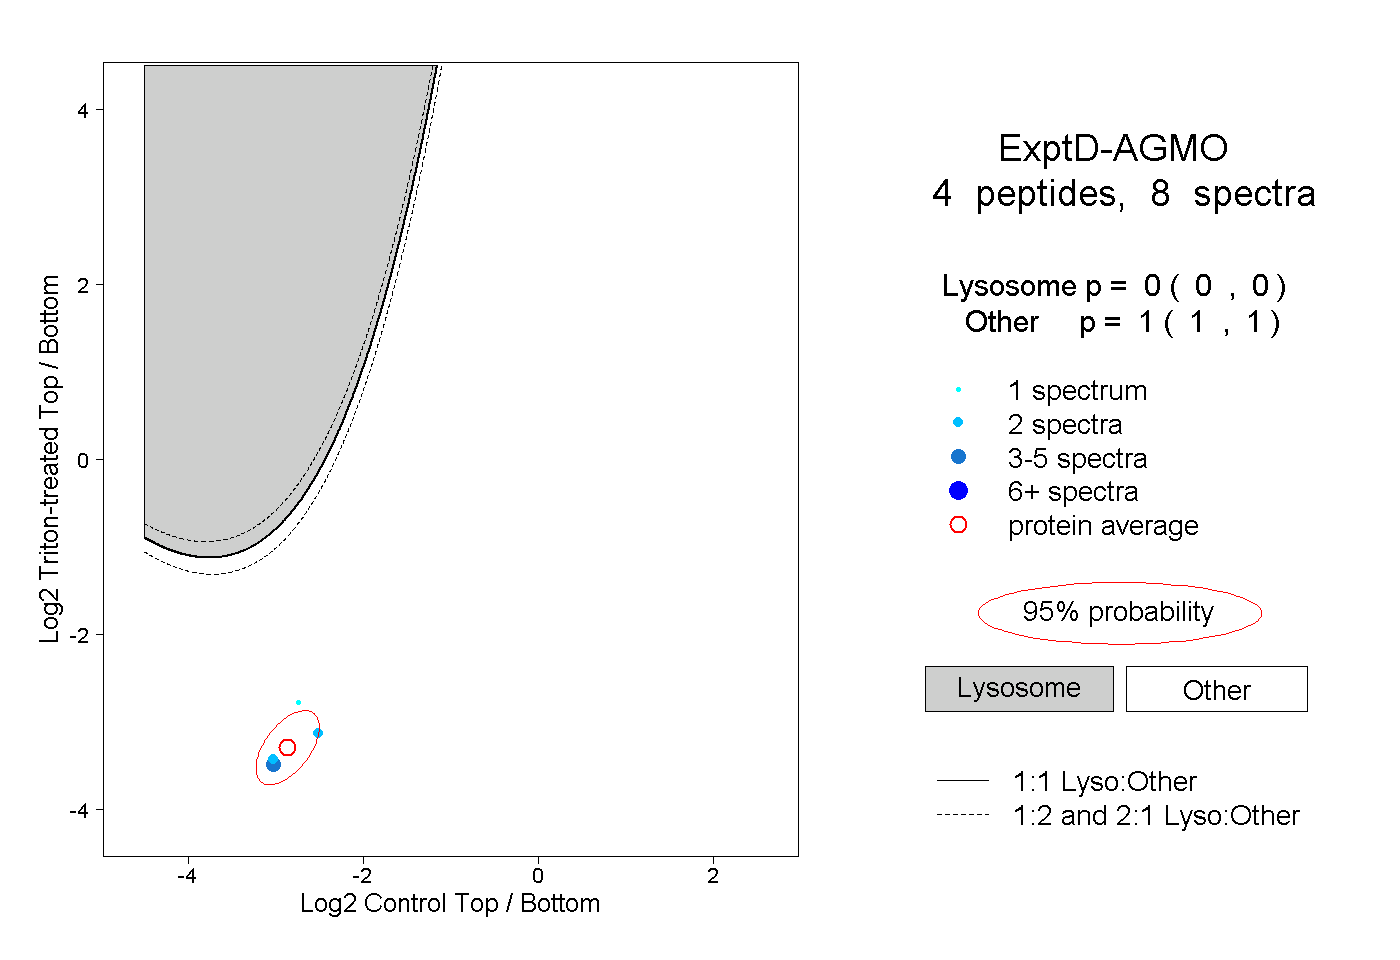 |
0.000 0.000 | 0.000 |
1.000 1.000 | 1.000 |