 2
2peptides
spectra
0.000 | 0.000
0.000 | 0.000
0.000 | 0.000
0.000 | 0.077
0.266 | 0.656
0.133 | 0.469
0.000 | 0.202
0.015 | 0.134
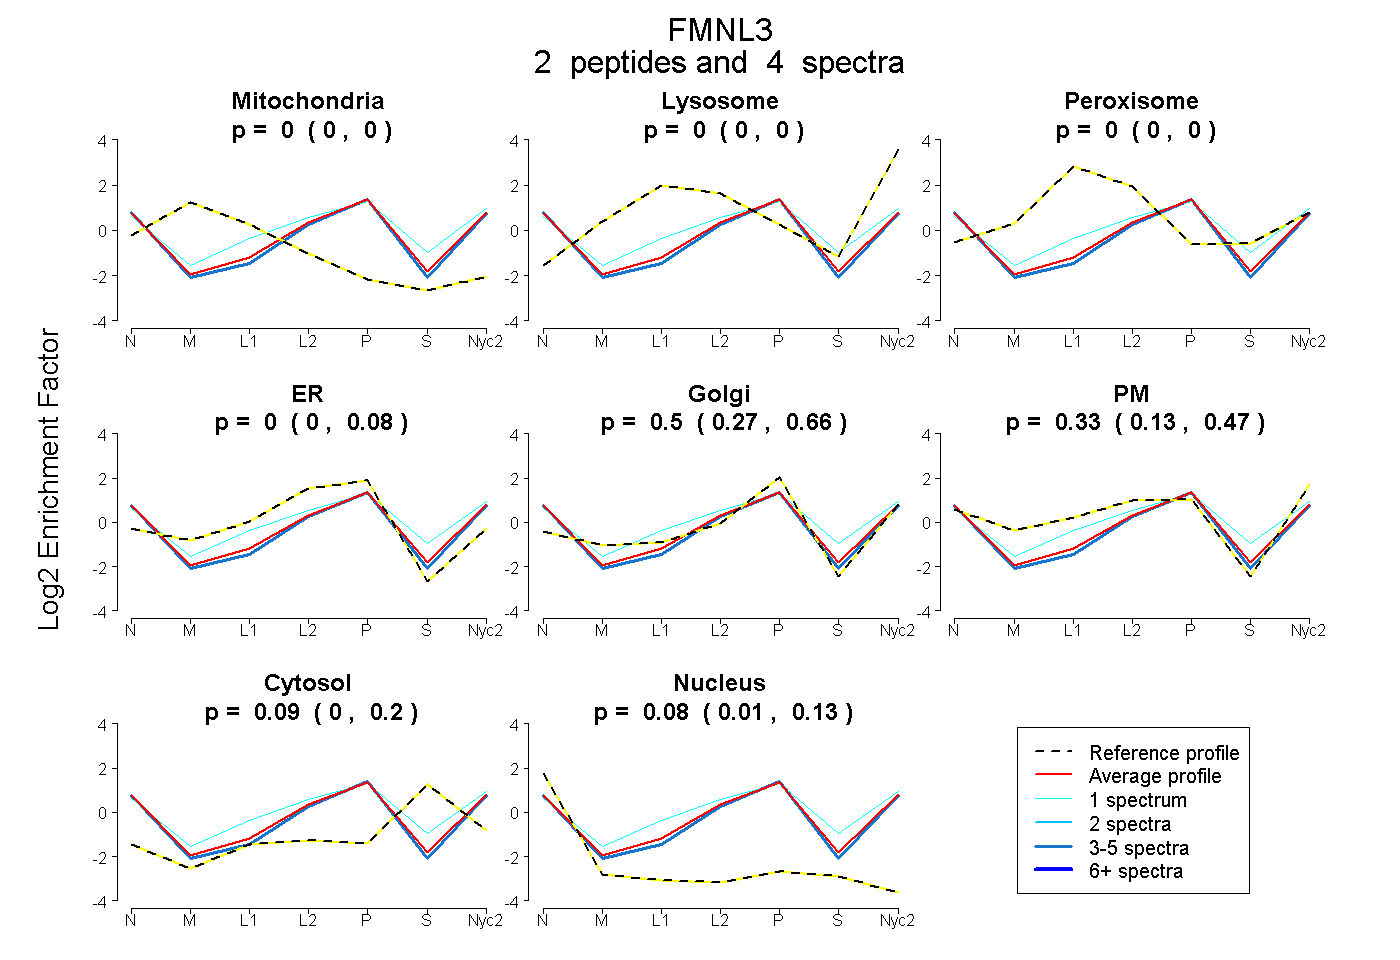
| Plot | Mito | Lyso | Perox | ER | Golgi | PM | Cytosol | Nucleus | |||||
| Expt A |
2 peptides |
4 spectra |
|
0.000 0.000 | 0.000 |
0.000 0.000 | 0.000 |
0.000 0.000 | 0.000 |
0.000 0.000 | 0.077 |
0.499 0.266 | 0.656 |
0.328 0.133 | 0.469 |
0.089 0.000 | 0.202 |
0.084 0.015 | 0.134 |
| 3 spectra, DGAIEDIITVLK | 0.000 | 0.000 | 0.000 | 0.000 | 0.597 | 0.246 | 0.032 | 0.125 | ||
| 1 spectrum, SVPFTAR | 0.000 | 0.000 | 0.000 | 0.056 | 0.143 | 0.569 | 0.231 | 0.000 |