 35
35peptides
spectra
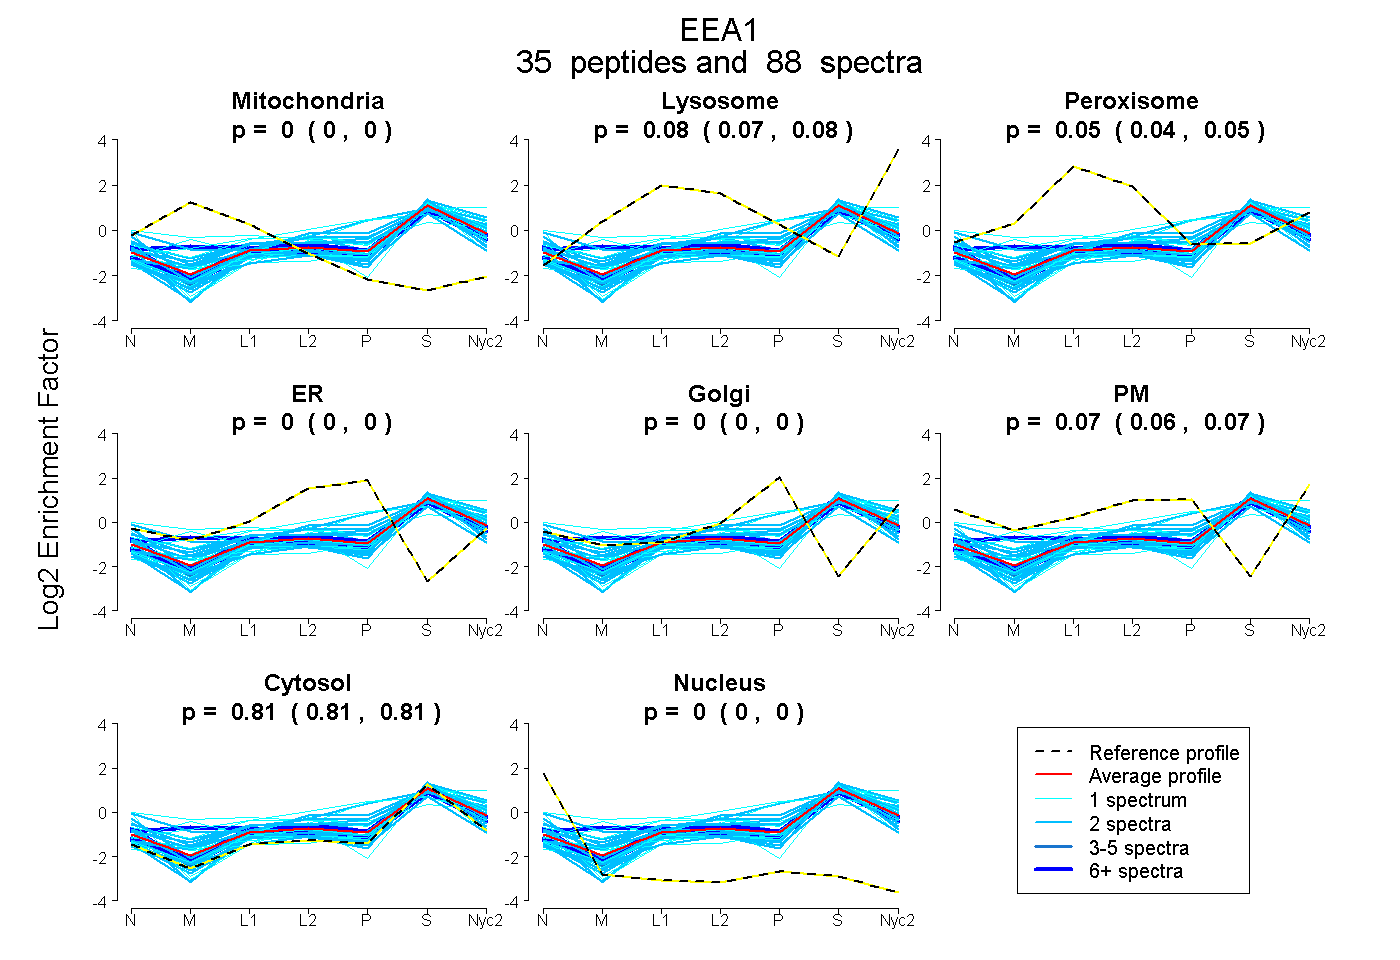
0.000 | 0.000
0.074 | 0.083
0.043 | 0.051
0.000 | 0.000
0.000 | 0.000
0.062 | 0.069
0.806 | 0.810
0.000 | 0.000
8peptides
spectra
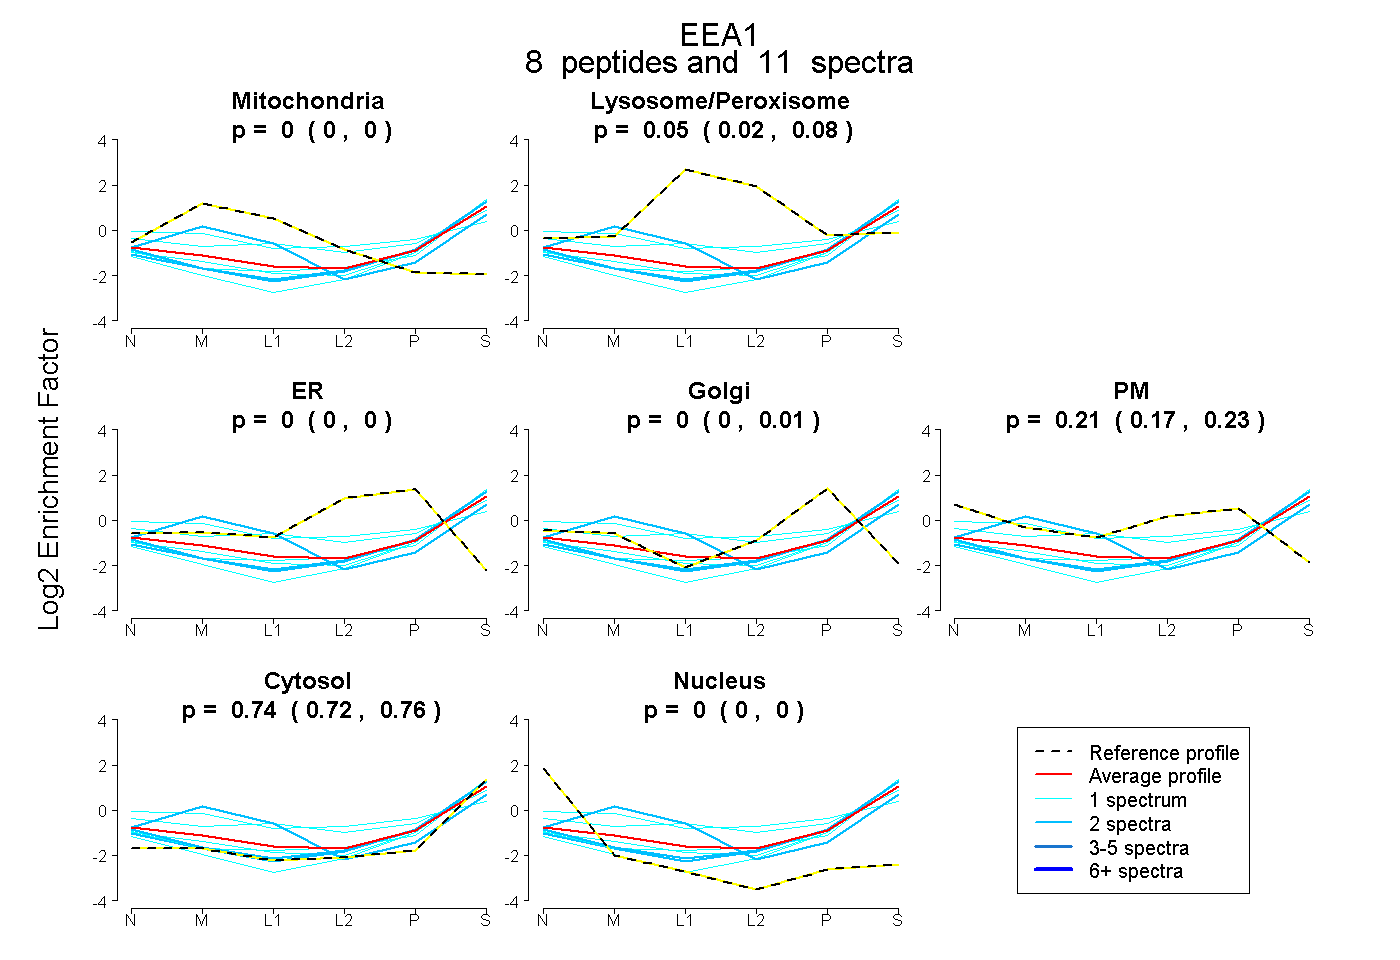
0.000 | 0.000
0.015 | 0.079
0.000 | 0.000
0.000 | 0.014
0.171 | 0.232
0.724 | 0.757
0.000 | 0.000
47peptides
spectra

0.000 | 0.000
1.000 | 1.000
9peptides
spectra
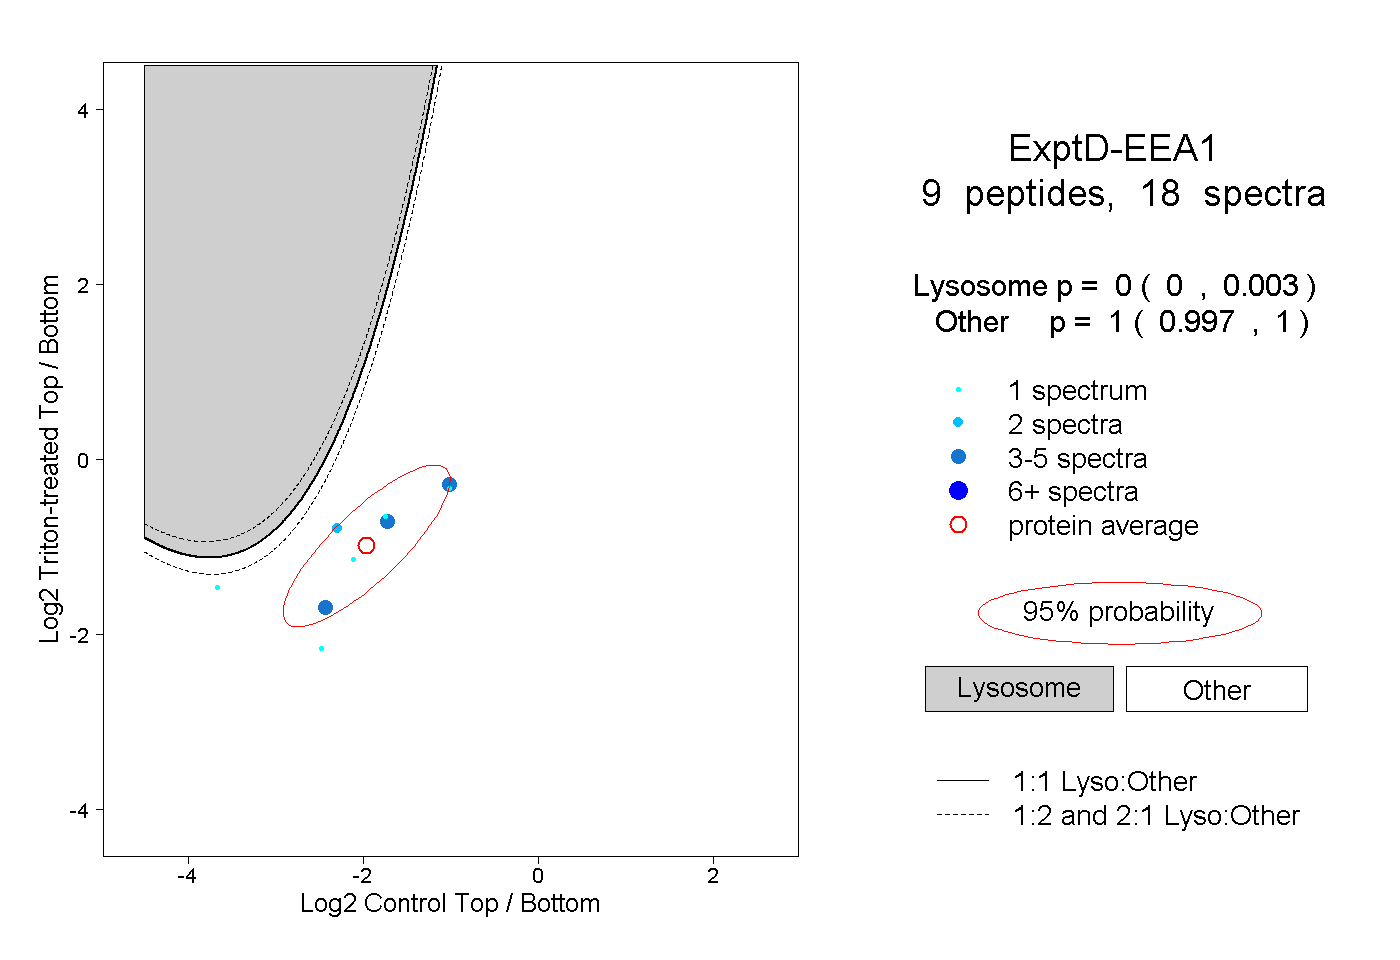
0.000 | 0.003
0.997 | 1.000