 6
6peptides
spectra
0.000 | 0.000
0.000 | 0.000
0.000 | 0.075
0.144 | 0.294
0.000 | 0.000
0.000 | 0.121
0.232 | 0.375
0.328 | 0.433
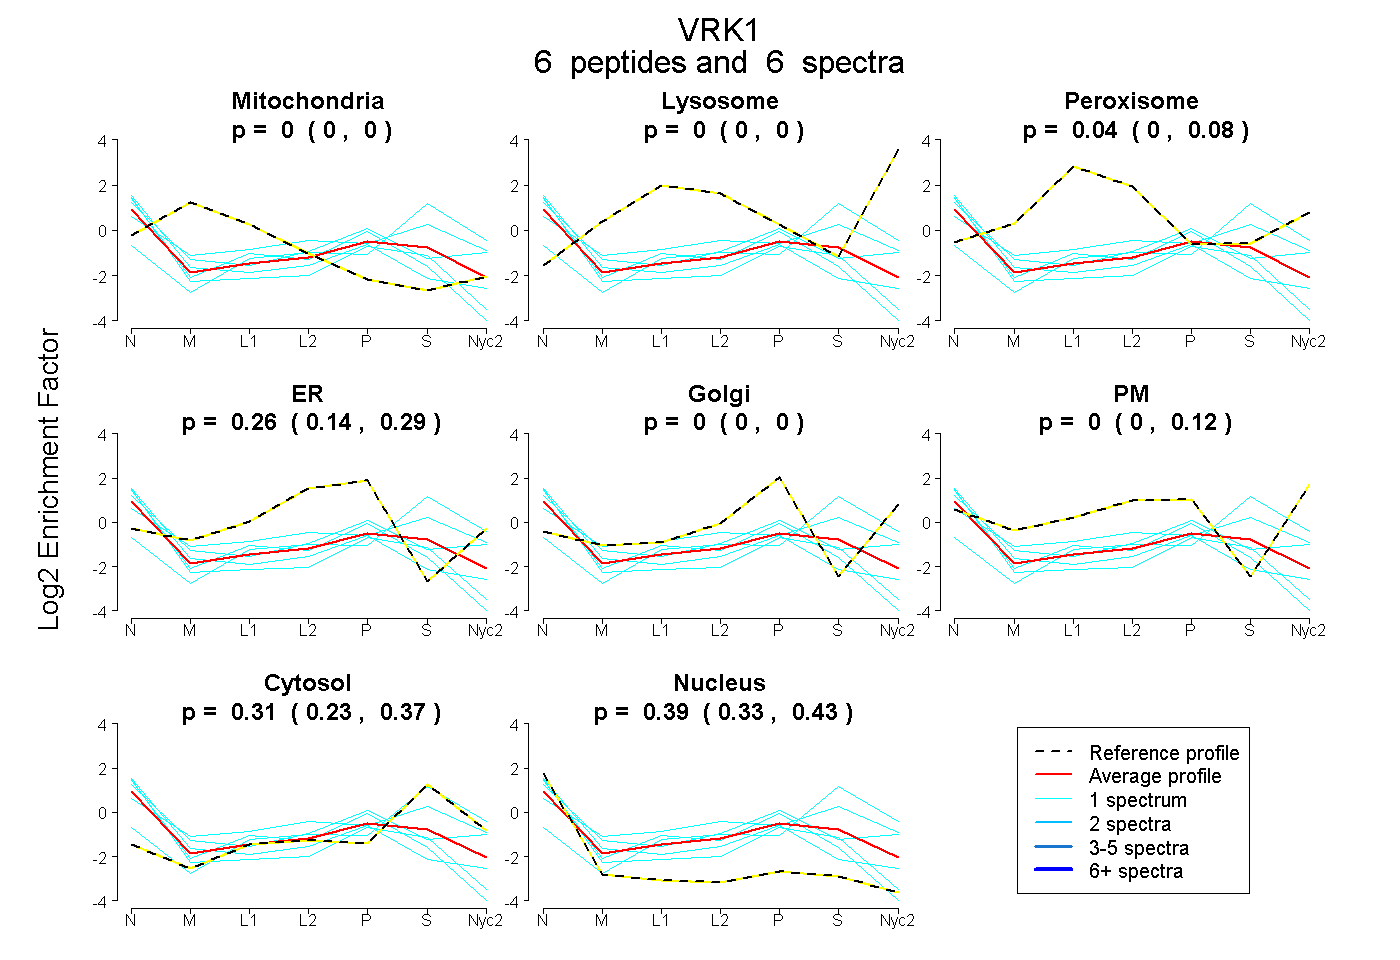
| Plot | Mito | Lyso | Perox | ER | Golgi | PM | Cytosol | Nucleus | |||||
| Expt A |
6 peptides |
6 spectra |
|
0.000 0.000 | 0.000 |
0.000 0.000 | 0.000 |
0.042 0.000 | 0.075 |
0.261 0.144 | 0.294 |
0.000 0.000 | 0.000 |
0.000 0.000 | 0.121 |
0.308 0.232 | 0.375 |
0.389 0.328 | 0.433 |
| 1 spectrum, DNVAALMEK | 0.000 | 0.000 | 0.000 | 0.032 | 0.132 | 0.324 | 0.180 | 0.332 | ||
| 1 spectrum, YLGVPK | 0.000 | 0.000 | 0.019 | 0.329 | 0.000 | 0.018 | 0.019 | 0.615 | ||
| 1 spectrum, TVLQLSLR | 0.000 | 0.000 | 0.000 | 0.000 | 0.000 | 0.098 | 0.902 | 0.000 | ||
| 1 spectrum, LAEQFAAGEIITDMSK | 0.000 | 0.000 | 0.190 | 0.003 | 0.000 | 0.190 | 0.435 | 0.183 | ||
| 1 spectrum, NPDQVYLVDYGLAYR | 0.000 | 0.000 | 0.000 | 0.171 | 0.000 | 0.000 | 0.199 | 0.630 | ||
| 1 spectrum, YCPDGVHK | 0.000 | 0.000 | 0.011 | 0.357 | 0.000 | 0.000 | 0.046 | 0.585 |