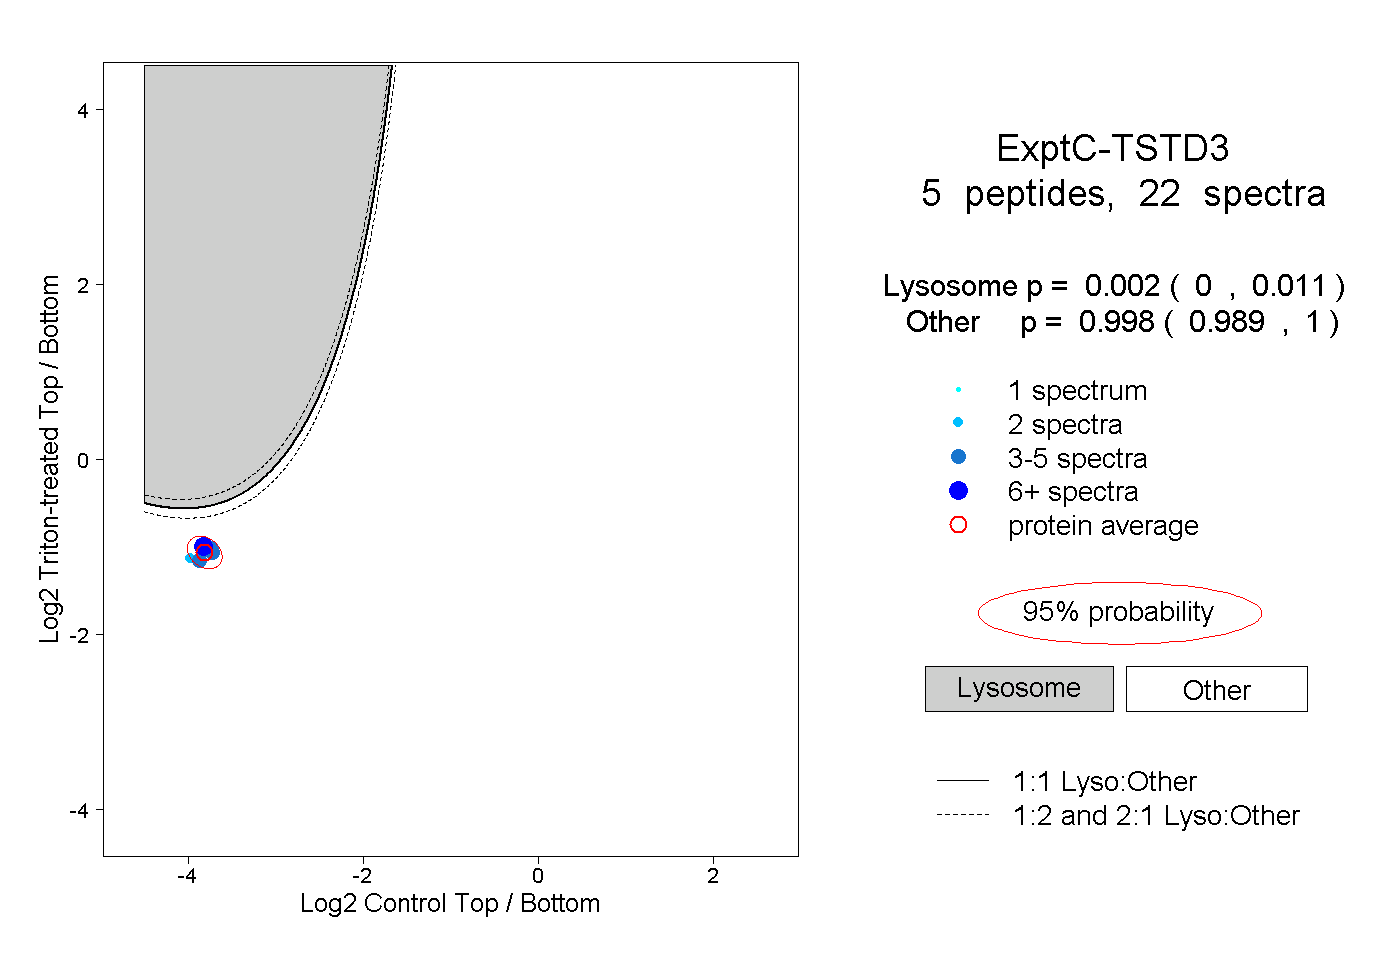
TSTD3
[ENSRNOP00000029537]
Main page
| | | Plot |
Mito |
Lyso |
|
Perox |
ER |
Golgi |
PM |
Cytosol |
Nucleus |
|
| Expt A |
 3
3
peptides |
17
spectra |
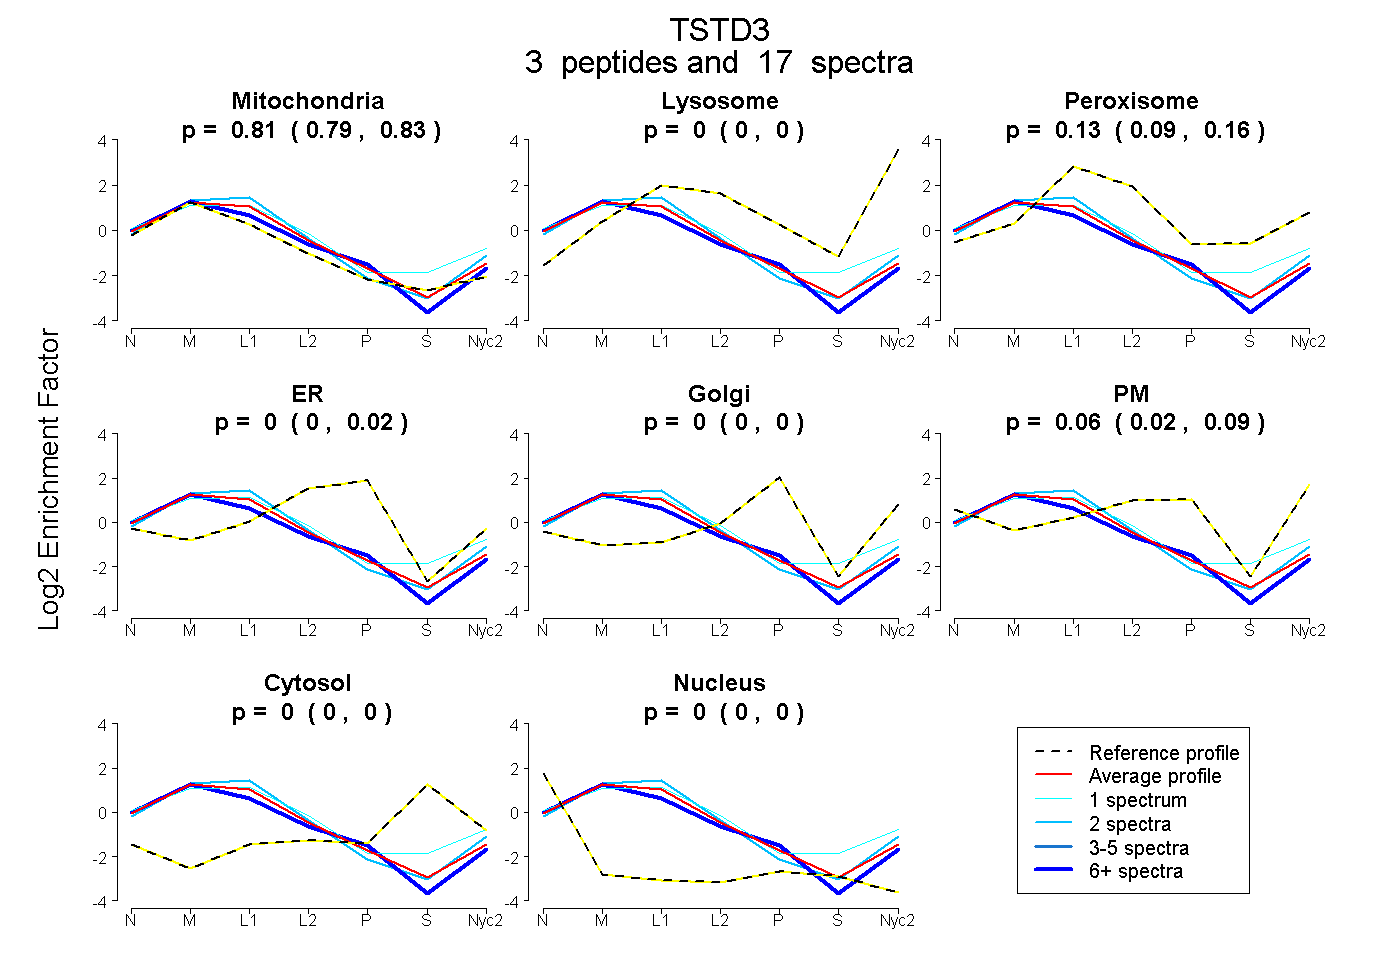 |
0.811
0.789 | 0.829 |
0.000
0.000 | 0.000 |
|
0.127
0.088 | 0.158 |
0.000
0.000 | 0.021 |
0.000
0.000 | 0.000 |
0.062
0.021 | 0.088 |
0.000
0.000 | 0.000 |
0.000
0.000 | 0.000 |
|
| | | Plot |
Mito |
|
Lyso or Perox |
|
ER |
Golgi |
PM |
Cytosol |
Nucleus |
|
| Expt B |
1
peptide |
2
spectra |
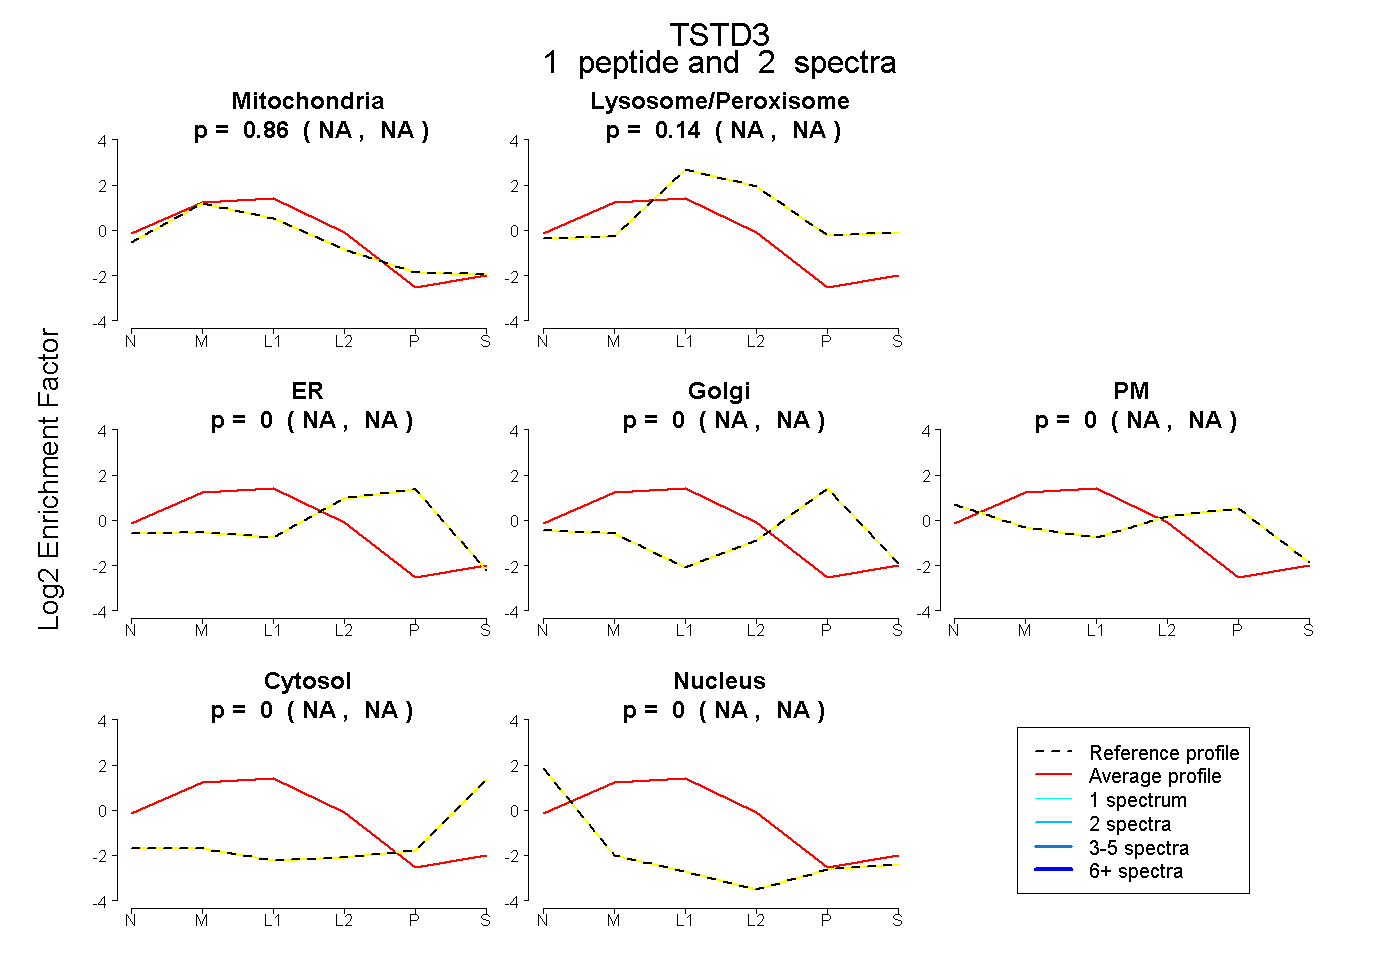 |
0.864
NA | NA |
|
0.136
NA | NA |
|
0.000
NA | NA |
0.000
NA | NA |
0.000
NA | NA |
0.000
NA | NA |
0.000
NA | NA |
|
| | | Plot |
|
Lyso |
|
|
|
|
|
|
|
Other |
| Expt C |
5
peptides |
22
spectra |
 |
|
0.002
0.000 | 0.011 |
|
|
|
|
|
|
|
0.998
0.989 | 1.000 |
| 6 spectra, YGEEKPSK |
|
0.004 |
|
|
|
|
|
|
|
0.996 |
| 4 spectra, DIMLIDVR |
|
0.003 |
|
|
|
|
|
|
|
0.997 |
| 5 spectra, NLLNSK |
|
0.002 |
|
|
|
|
|
|
|
0.998 |
| 5 spectra, NTWEILEHGK |
|
0.001 |
|
|
|
|
|
|
|
0.999 |
| 2 spectra, LVFSCLAGVR |
|
0.001 |
|
|
|
|
|
|
|
0.999 |