 2
2peptides
spectra
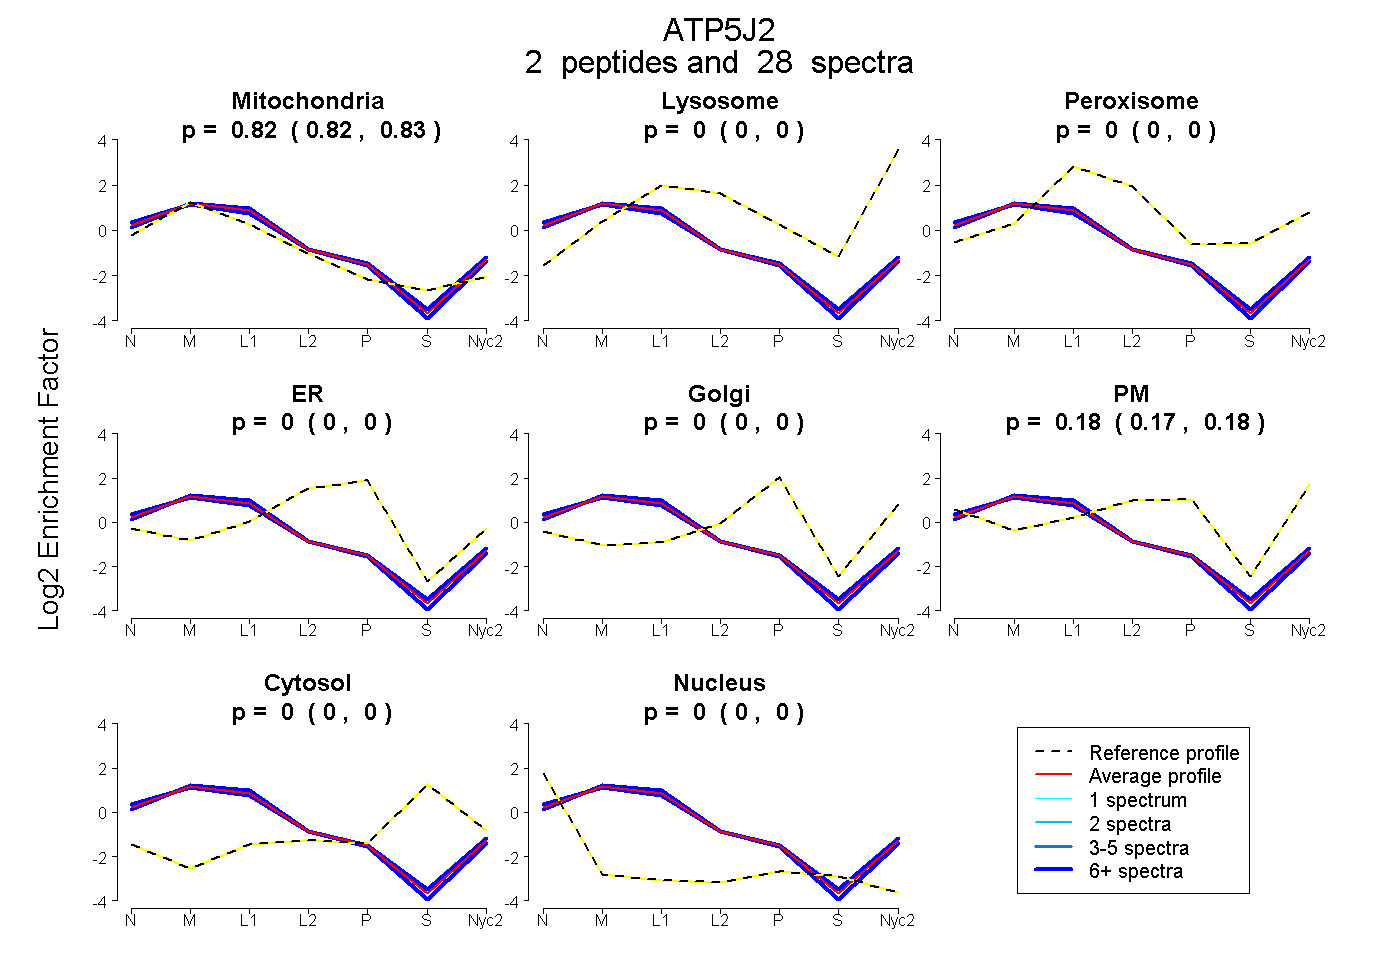
0.820 | 0.828
0.000 | 0.000
0.000 | 0.000
0.000 | 0.000
0.000 | 0.000
0.172 | 0.179
0.000 | 0.000
0.000 | 0.000
2peptides
spectra
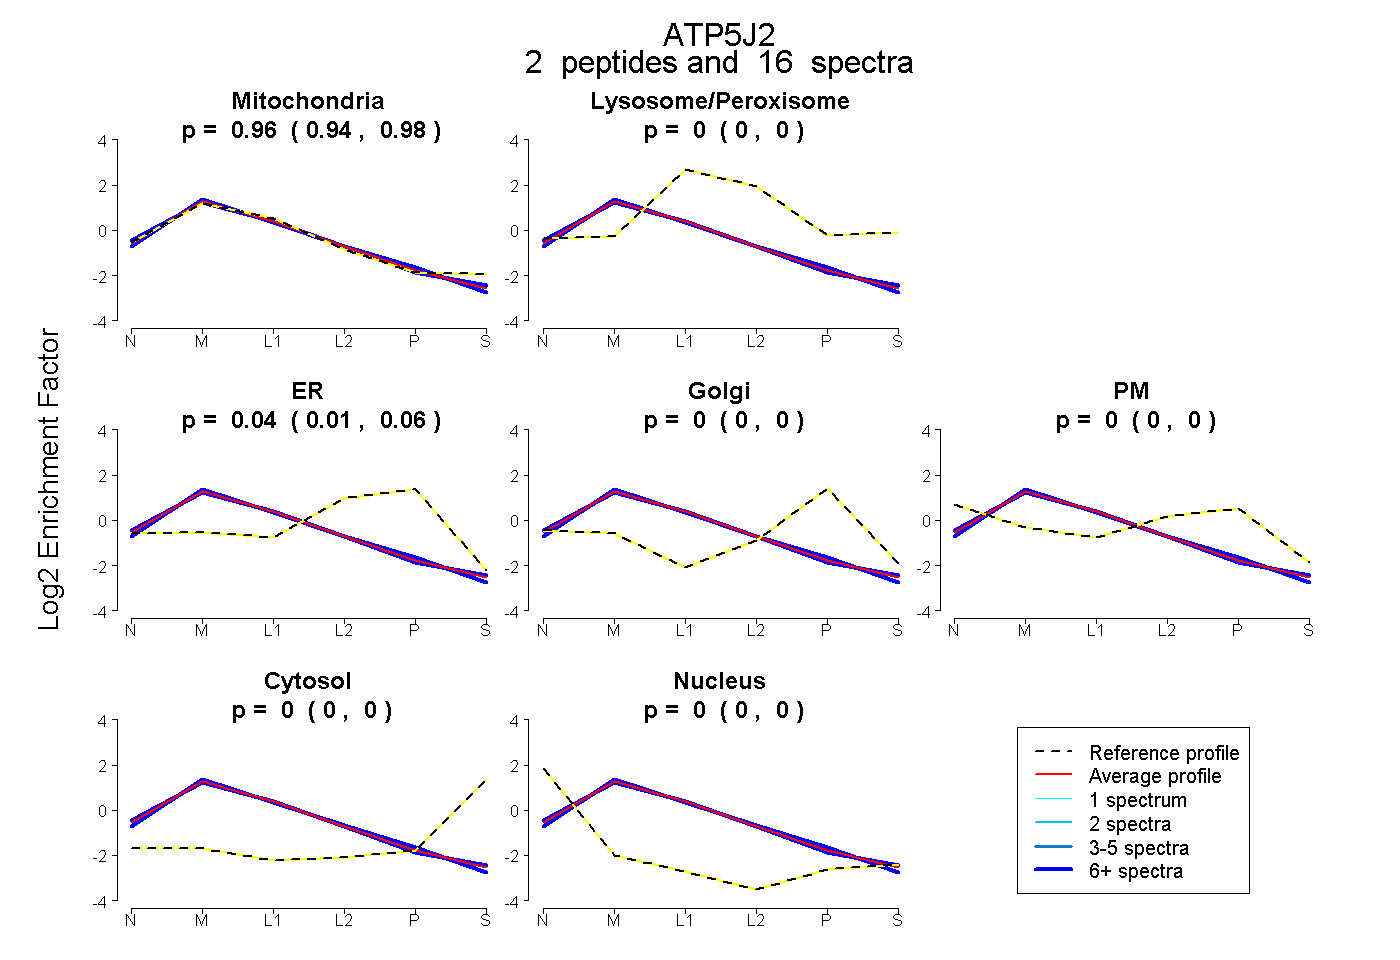
0.940 | 0.980
0.000 | 0.000
0.013 | 0.057
0.000 | 0.000
0.000 | 0.000
0.000 | 0.000
0.000 | 0.005
4peptides
spectra
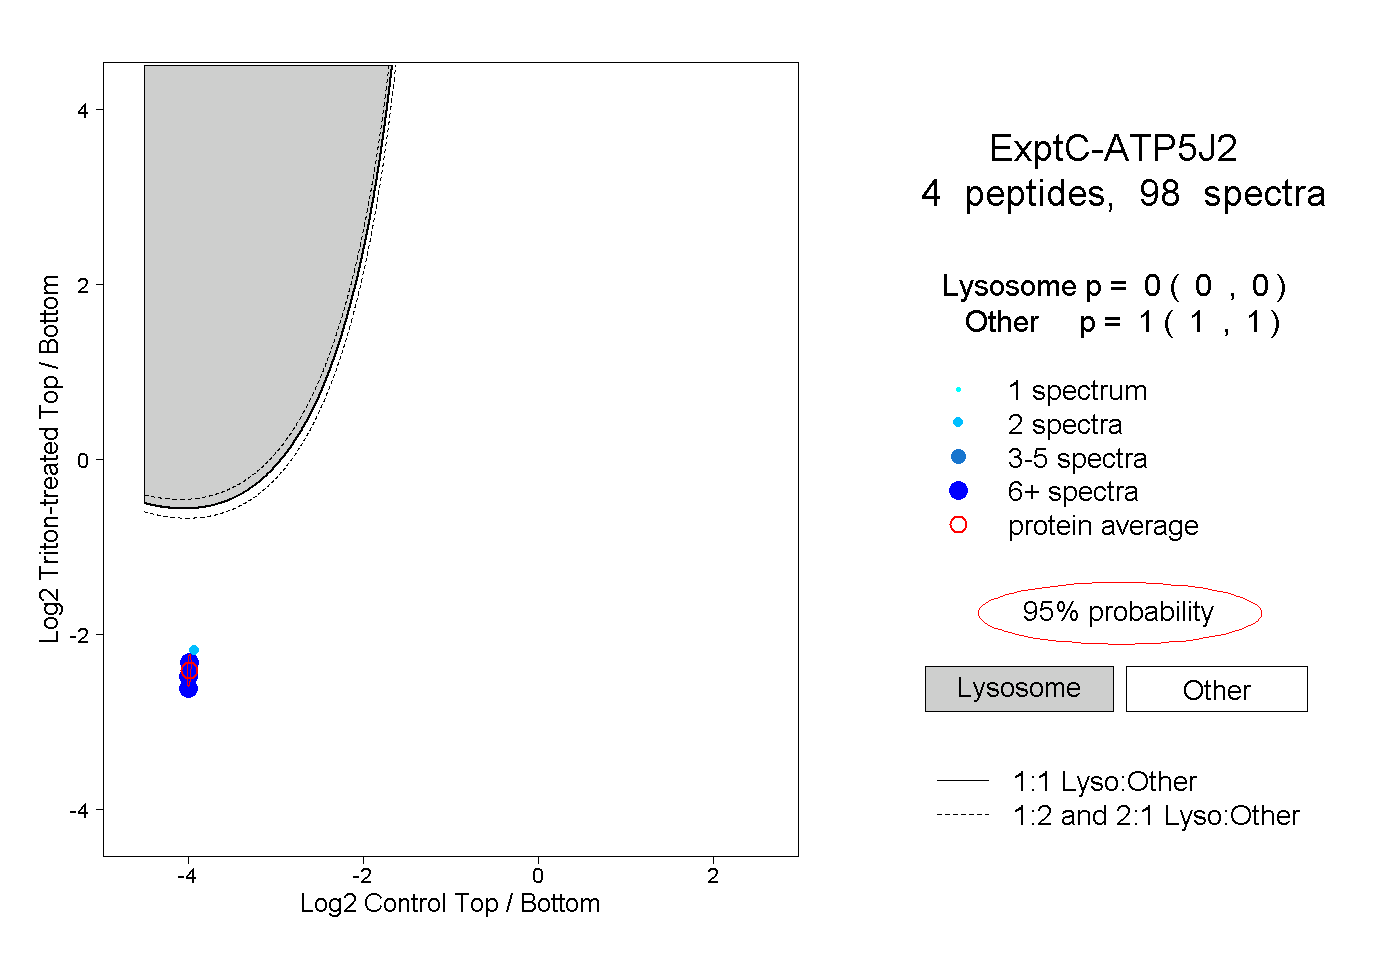
0.000 | 0.000
1.000 | 1.000