 4
4peptides
spectra
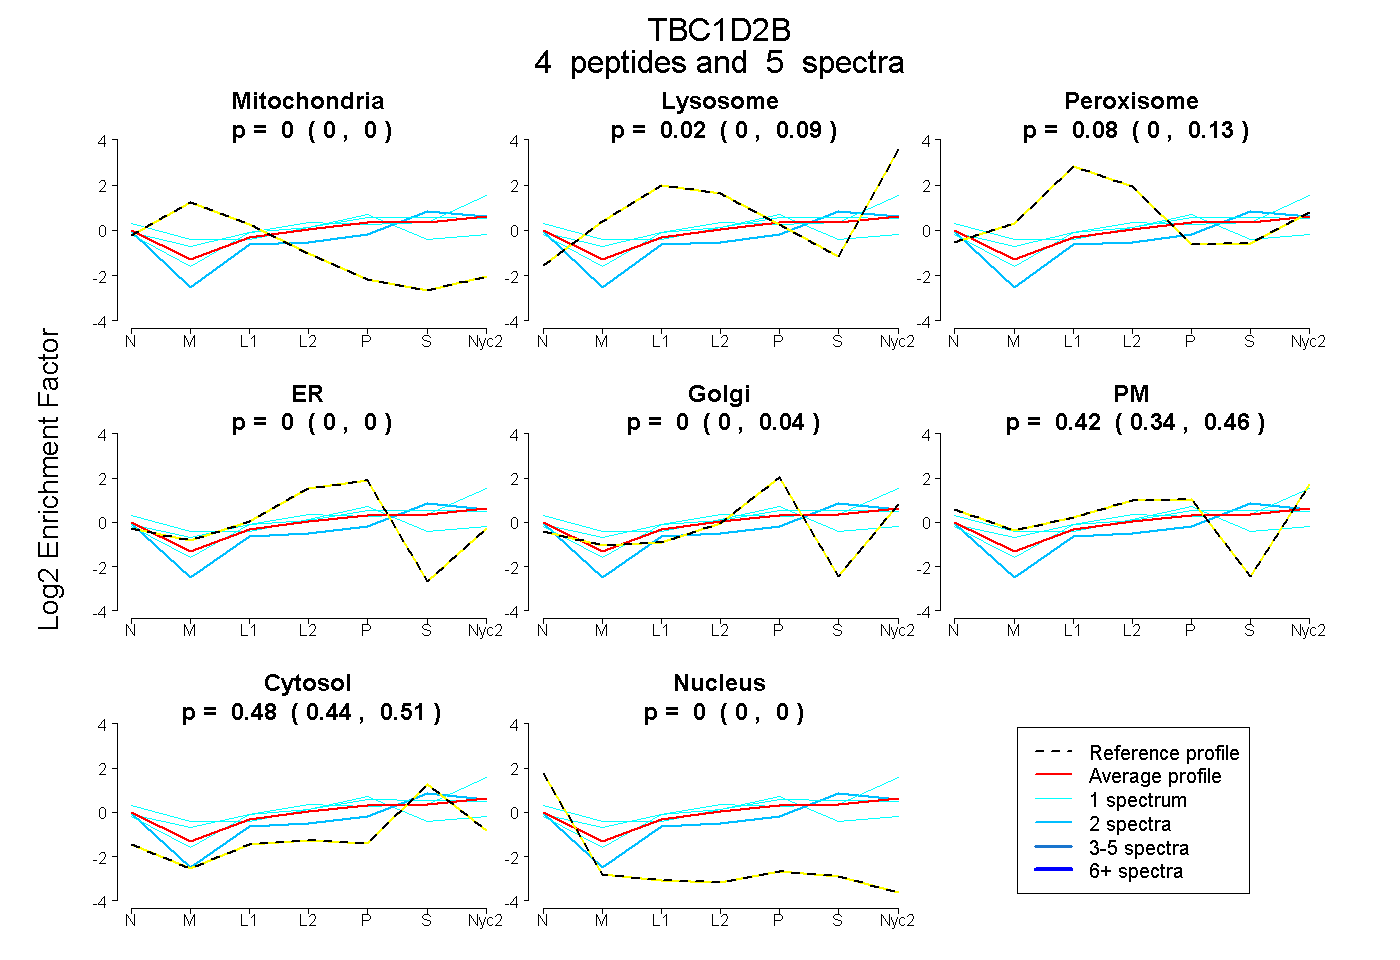
0.000 | 0.000
0.000 | 0.093
0.000 | 0.128
0.000 | 0.000
0.000 | 0.041
0.342 | 0.455
0.443 | 0.513
0.000 | 0.000
6peptides
spectra
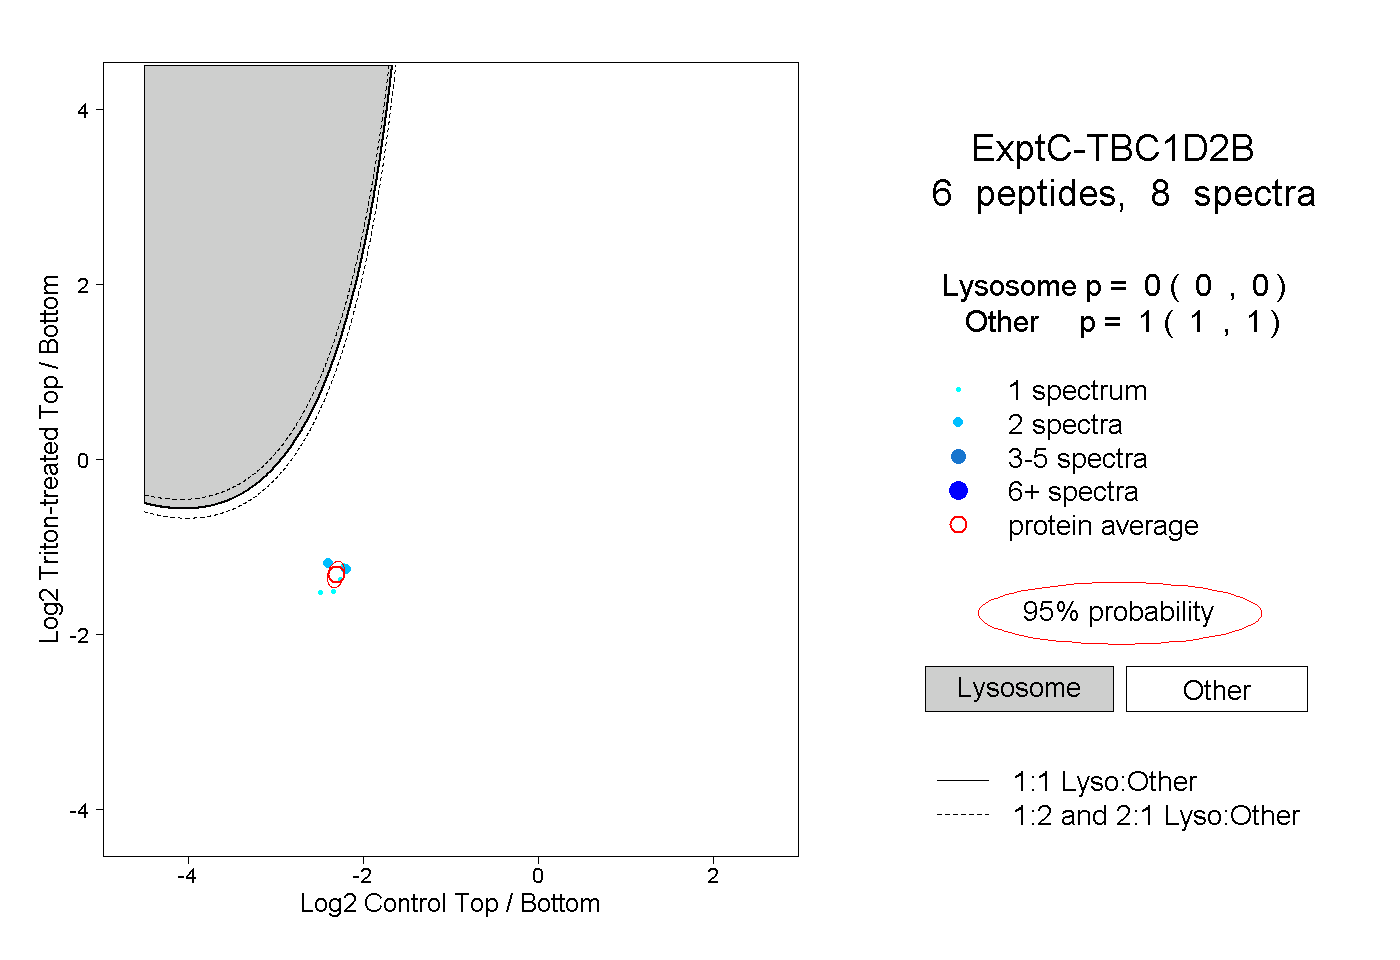
0.000 | 0.000
1.000 | 1.000
| Plot | Mito | Lyso | Perox | ER | Golgi | PM | Cytosol | Nucleus | |||||
| Expt A |
4 peptides |
5 spectra |
|
0.000 0.000 | 0.000 |
0.018 0.000 | 0.093 |
0.082 0.000 | 0.128 |
0.000 0.000 | 0.000 |
0.000 0.000 | 0.041 |
0.421 0.342 | 0.455 |
0.479 0.443 | 0.513 |
0.000 0.000 | 0.000 |
||
| Plot | Lyso | Other | |||||||||||
| Expt C |
6 peptides |
8 spectra |
|
0.000 0.000 | 0.000 |
1.000 1.000 | 1.000 |