 3
3peptides
spectra
0.393 | 0.542
0.000 | 0.000
0.094 | 0.239
0.000 | 0.081
0.000 | 0.149
0.062 | 0.289
0.016 | 0.155
0.000 | 0.041
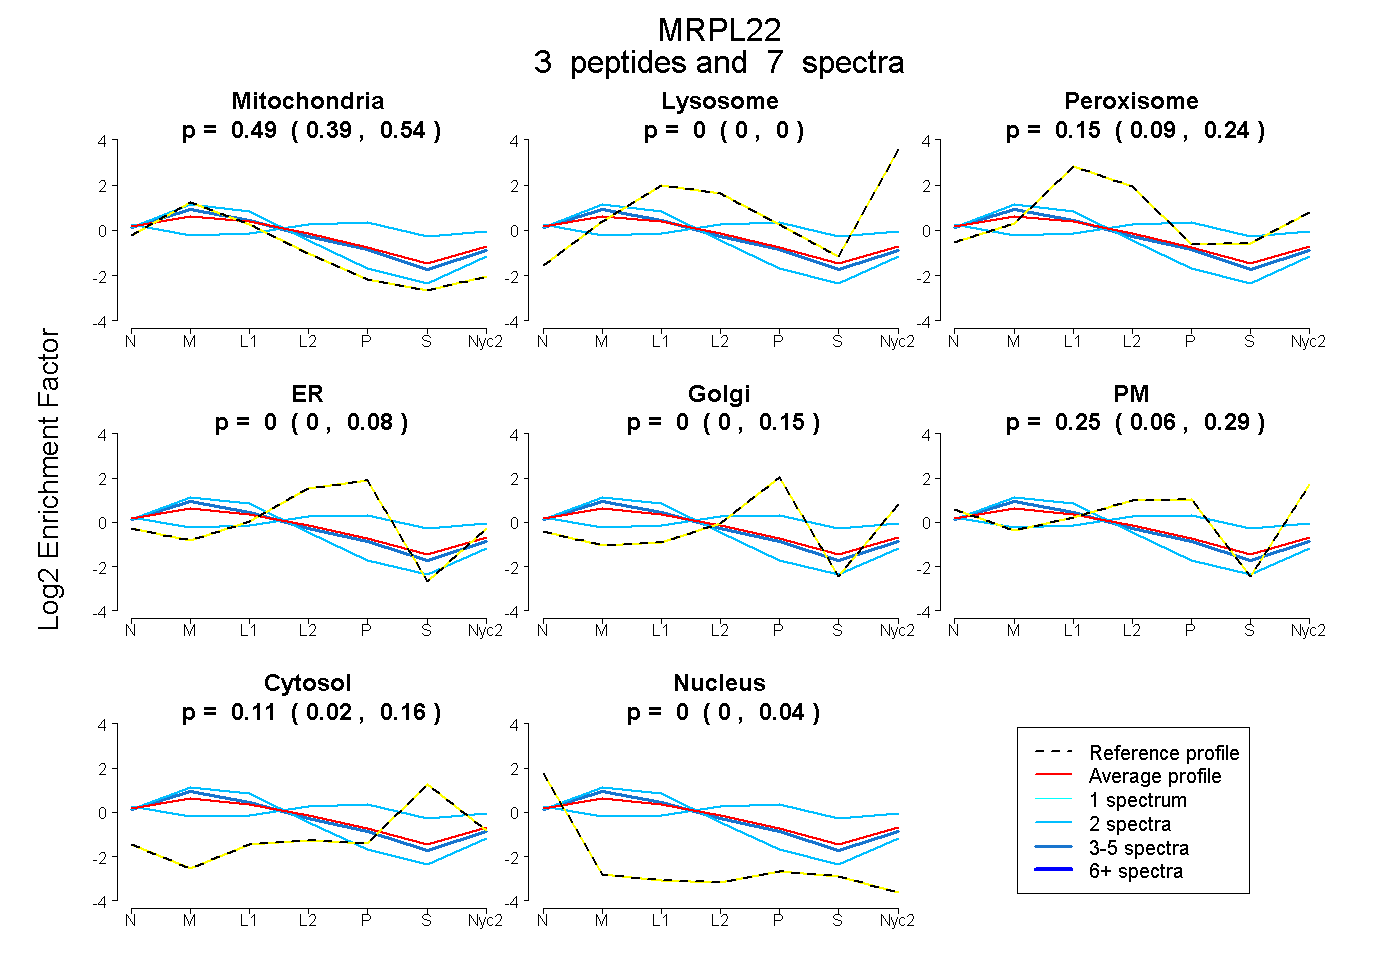
| Plot | Mito | Lyso | Perox | ER | Golgi | PM | Cytosol | Nucleus | |||||
| Expt A |
3 peptides |
7 spectra |
|
0.485 0.393 | 0.542 |
0.000 0.000 | 0.000 |
0.150 0.094 | 0.239 |
0.004 0.000 | 0.081 |
0.000 0.000 | 0.149 |
0.253 0.062 | 0.289 |
0.108 0.016 | 0.155 |
0.000 0.000 | 0.041 |
| 3 spectra, DHNVEFR | 0.582 | 0.000 | 0.148 | 0.000 | 0.043 | 0.184 | 0.042 | 0.000 | ||
| 2 spectra, EVLLEAQDMAVR | 0.081 | 0.000 | 0.149 | 0.106 | 0.000 | 0.345 | 0.318 | 0.000 | ||
| 2 spectra, EYIQQLR | 0.753 | 0.000 | 0.161 | 0.000 | 0.000 | 0.086 | 0.000 | 0.000 |
| Plot | Mito | Lyso or Perox | ER | Golgi | PM | Cytosol | Nucleus | ||||||
| Expt B |
1 peptide |
1 spectrum |
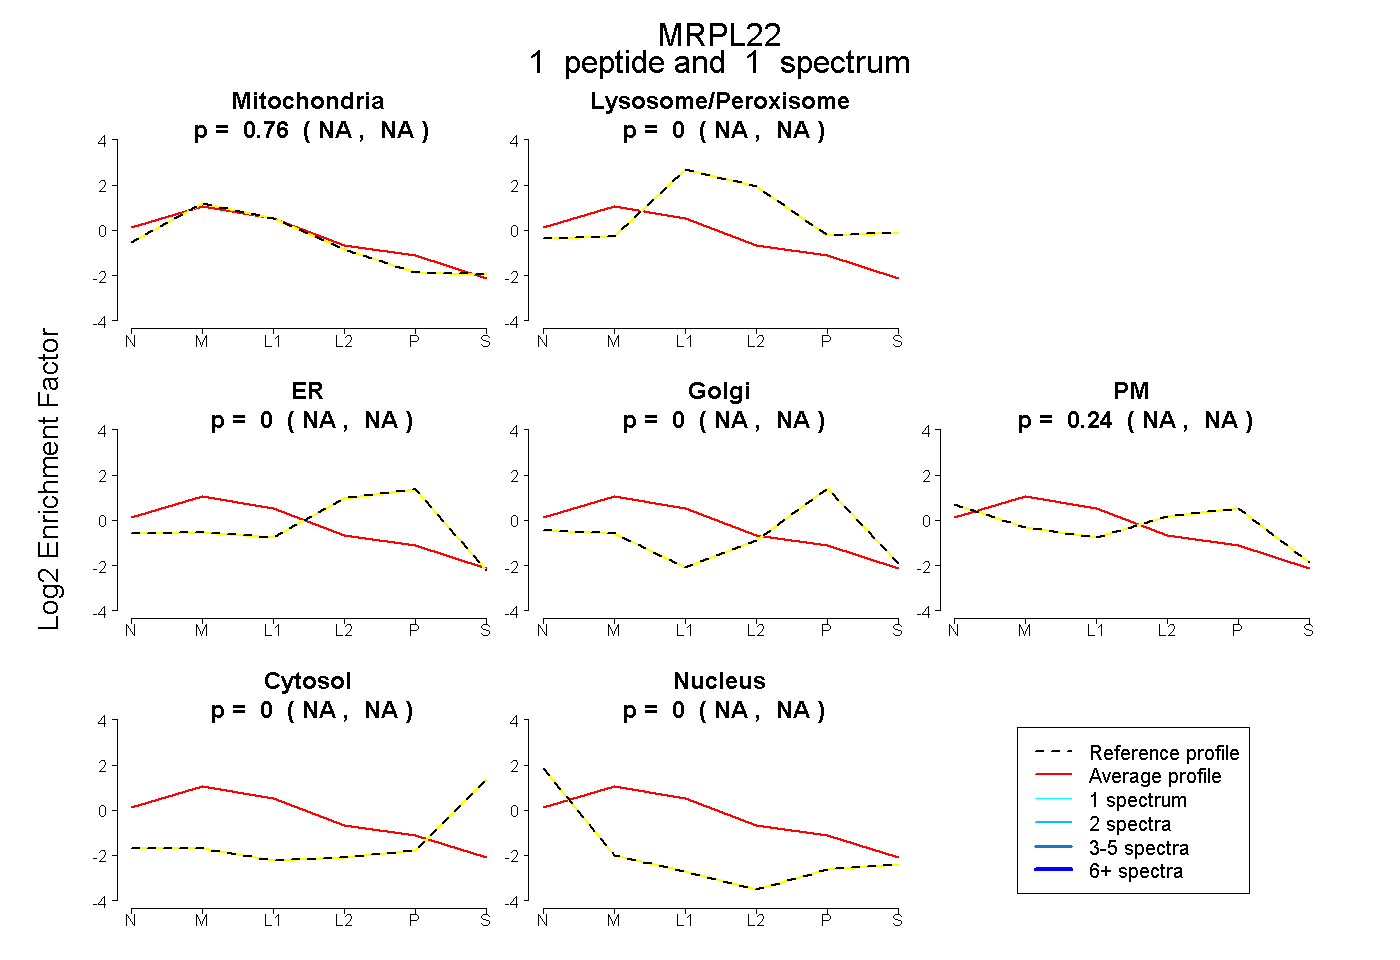 |
0.756 NA | NA |
0.005 NA | NA |
0.000 NA | NA |
0.000 NA | NA |
0.240 NA | NA |
0.000 NA | NA |
0.000 NA | NA |
|||
| Plot | Lyso | Other | |||||||||||
| Expt C |
13 peptides |
55 spectra |
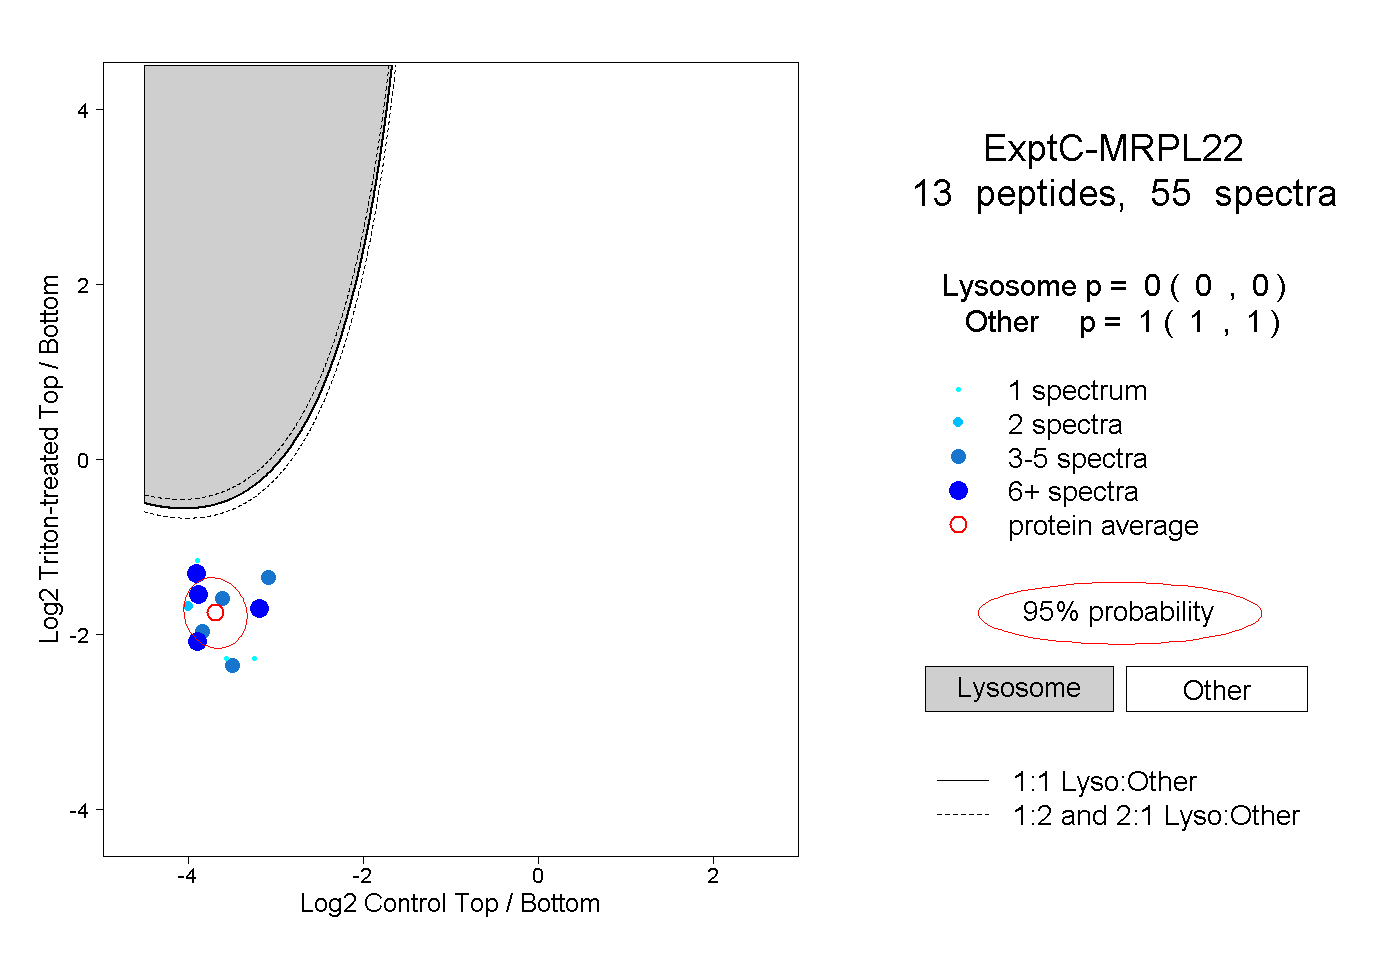 |
0.000 0.000 | 0.000 |
1.000 1.000 | 1.000 |
||||||||
| Plot | Lyso | Other | |||||||||||
| Expt D |
2 peptides |
2 spectra |
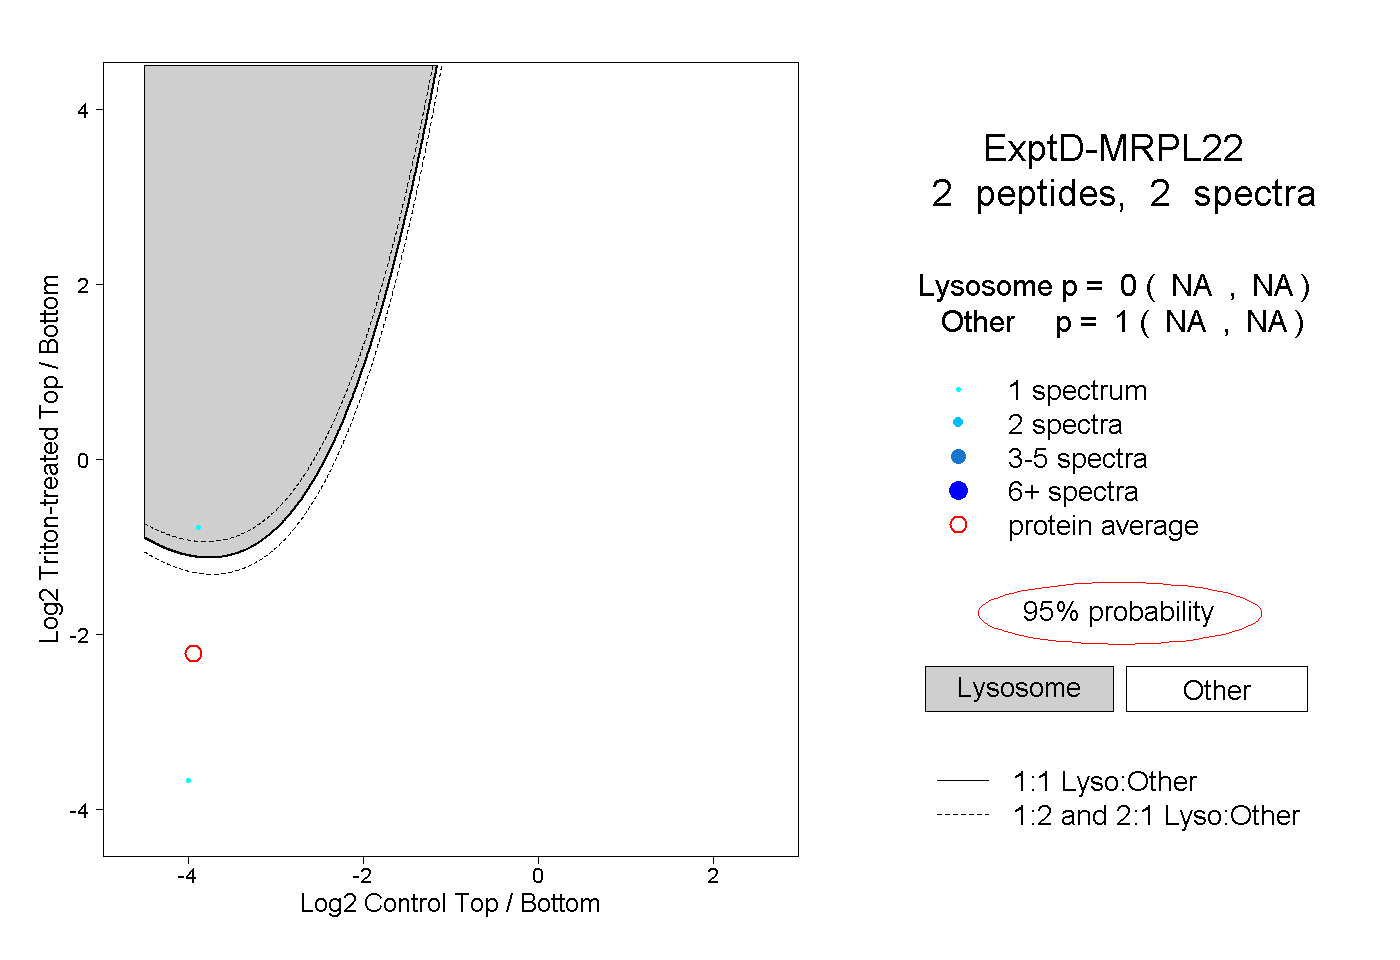 |
0.000 NA | NA |
1.000 NA | NA |