SORBS2
[ENSRNOP00000029182]
Main page
| | | Plot |
Mito |
Lyso |
|
Perox |
ER |
Golgi |
PM |
Cytosol |
Nucleus |
|
| Expt A |
 20
20
peptides |
58
spectra |
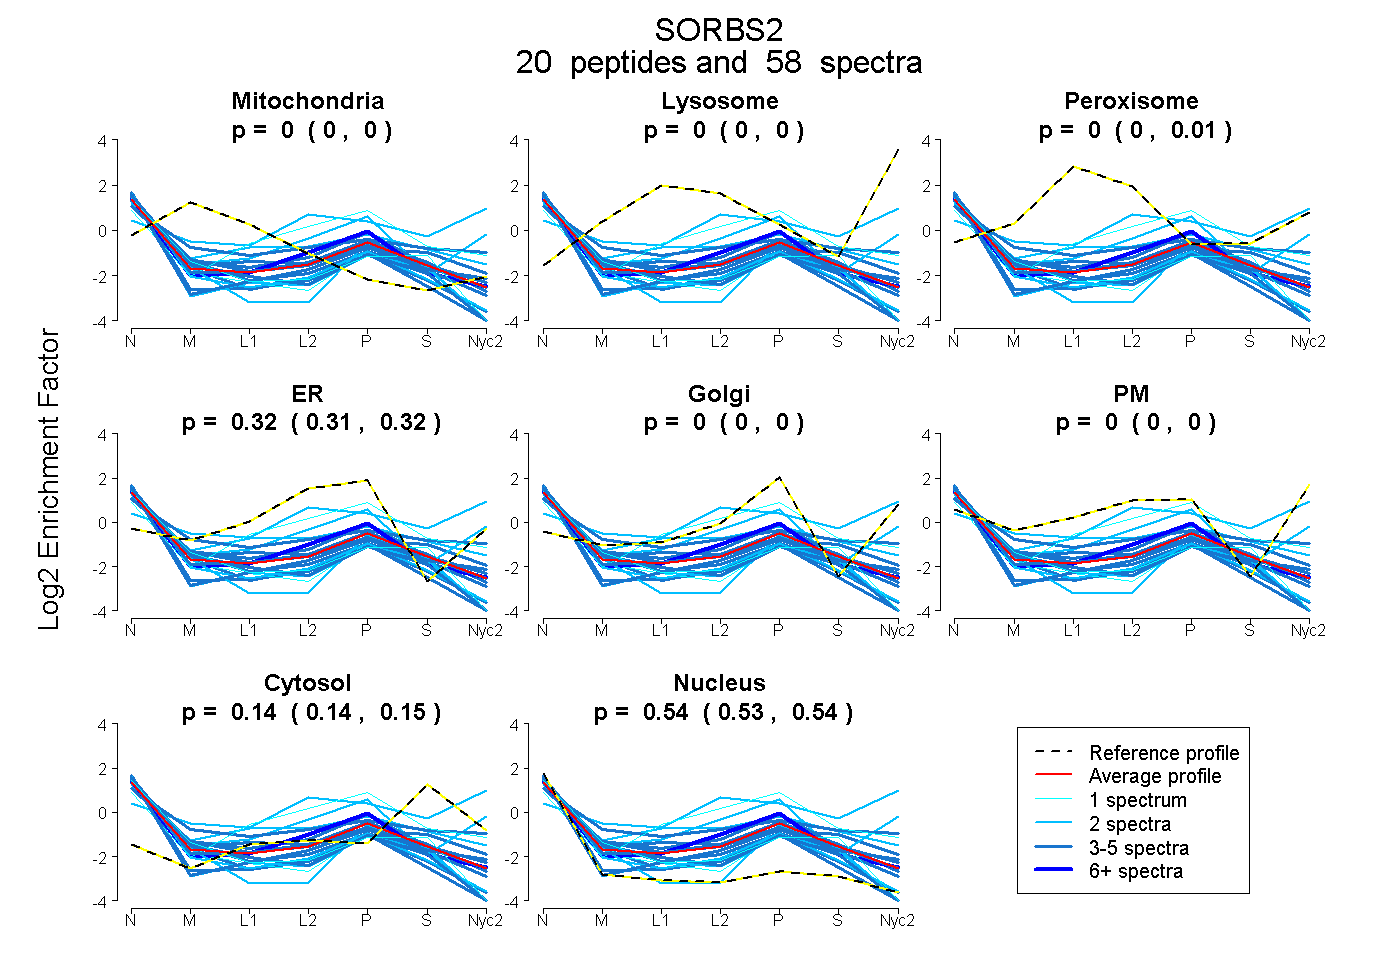 |
0.000
0.000 | 0.000 |
0.000
0.000 | 0.000 |
|
0.000
0.000 | 0.006 |
0.318
0.309 | 0.322 |
0.000
0.000 | 0.000 |
0.000
0.000 | 0.000 |
0.143
0.136 | 0.148 |
0.539
0.532 | 0.545 |
|
| | | Plot |
Mito |
|
Lyso or Perox |
|
ER |
Golgi |
PM |
Cytosol |
Nucleus |
|
| Expt B |
6
peptides |
10
spectra |
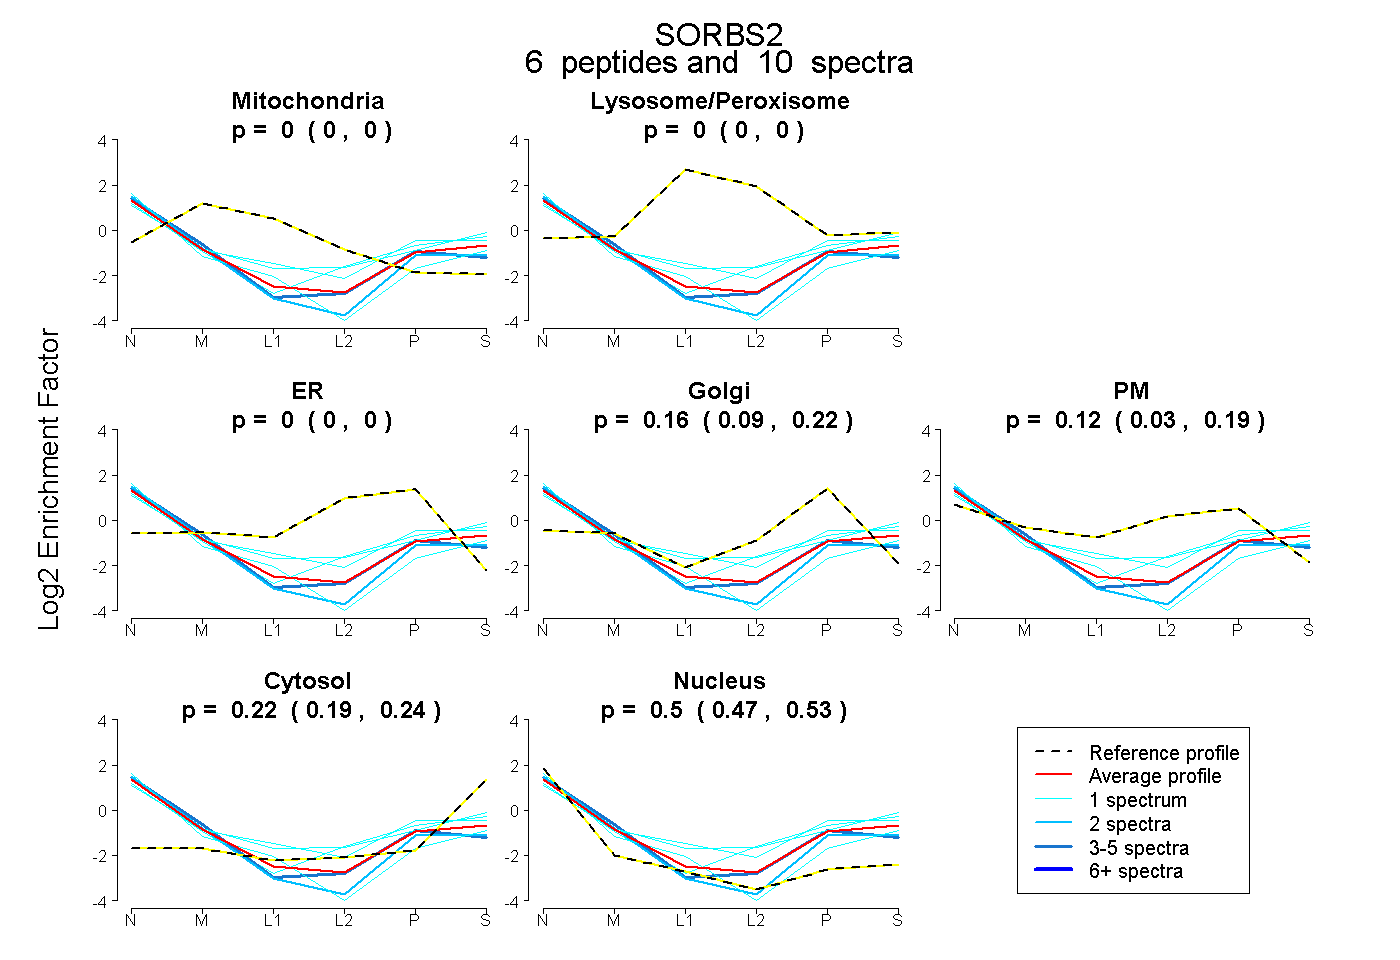 |
0.000
0.000 | 0.000 |
|
0.000
0.000 | 0.000 |
|
0.000
0.000 | 0.000 |
0.165
0.094 | 0.220 |
0.116
0.034 | 0.188 |
0.216
0.193 | 0.237 |
0.503
0.472 | 0.528 |
|
| 1 spectrum, TTVDRPK |
0.039 |
|
0.000 |
|
0.000 |
0.027 |
0.000 |
0.199 |
0.734 |
|
| 1 spectrum, SIFEYEPGK |
0.000 |
|
0.000 |
|
0.000 |
0.000 |
0.445 |
0.254 |
0.302 |
|
| 1 spectrum, ESDVVDVMEK |
0.000 |
|
0.000 |
|
0.000 |
0.119 |
0.276 |
0.290 |
0.315 |
|
| 1 spectrum, SVRPNLQDK |
0.000 |
|
0.037 |
|
0.000 |
0.000 |
0.377 |
0.313 |
0.273 |
|
| 4 spectra, NEDELELR |
0.000 |
|
0.000 |
|
0.000 |
0.333 |
0.000 |
0.089 |
0.577 |
|
| 2 spectra, SYSSTLTDLGR |
0.000 |
|
0.000 |
|
0.000 |
0.189 |
0.000 |
0.134 |
0.677 |
|
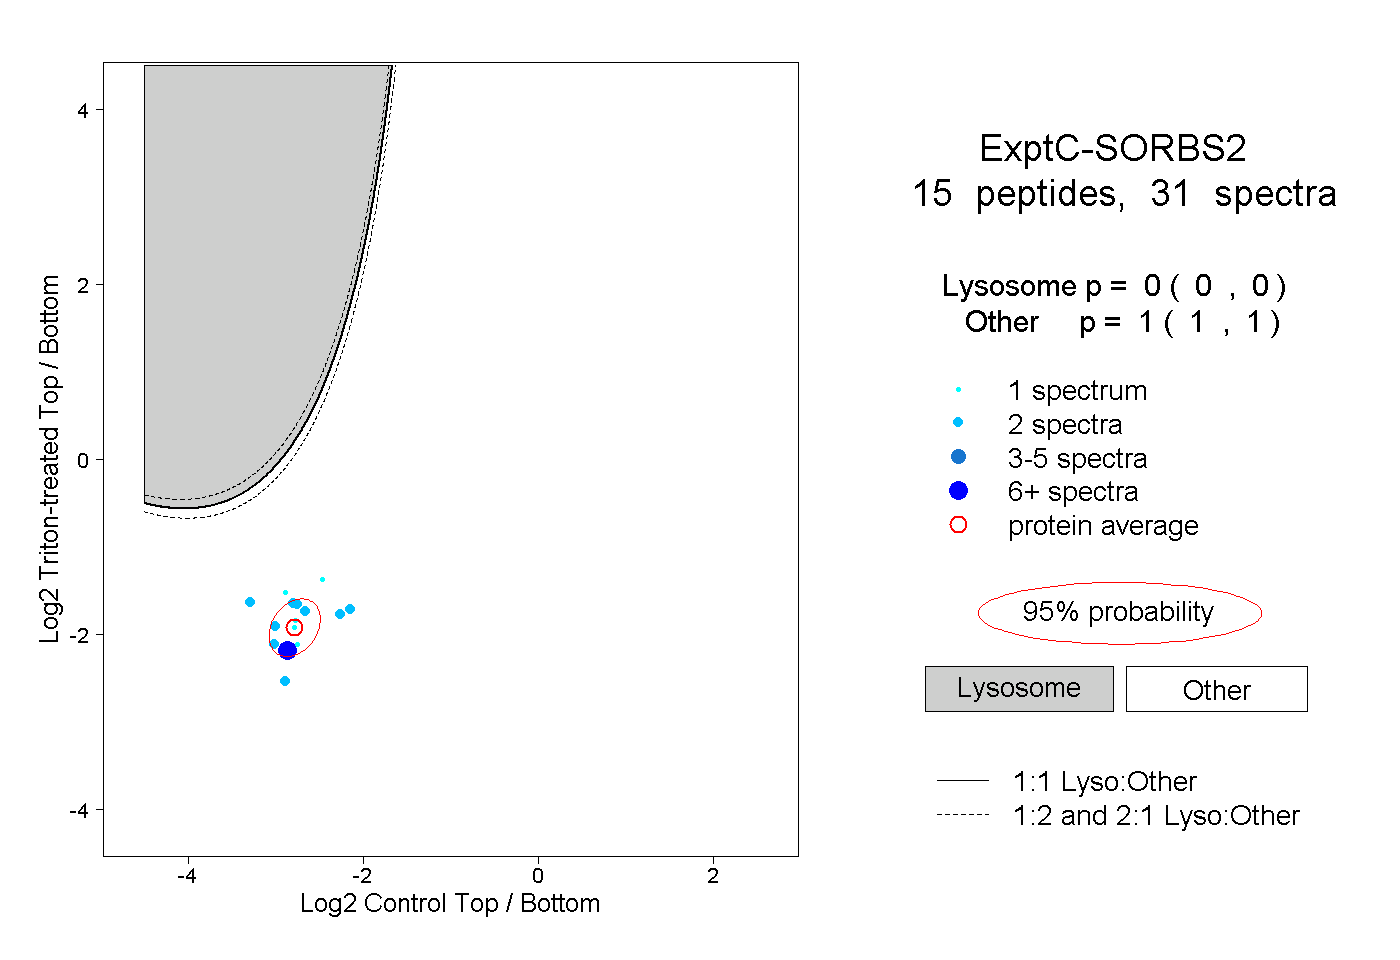
| | | Plot |
|
Lyso |
|
|
|
|
|
|
|
Other |
| Expt C |
15
peptides |
31
spectra |
 |
|
0.000
0.000 | 0.000 |
|
|
|
|
|
|
|
1.000
1.000 | 1.000 |
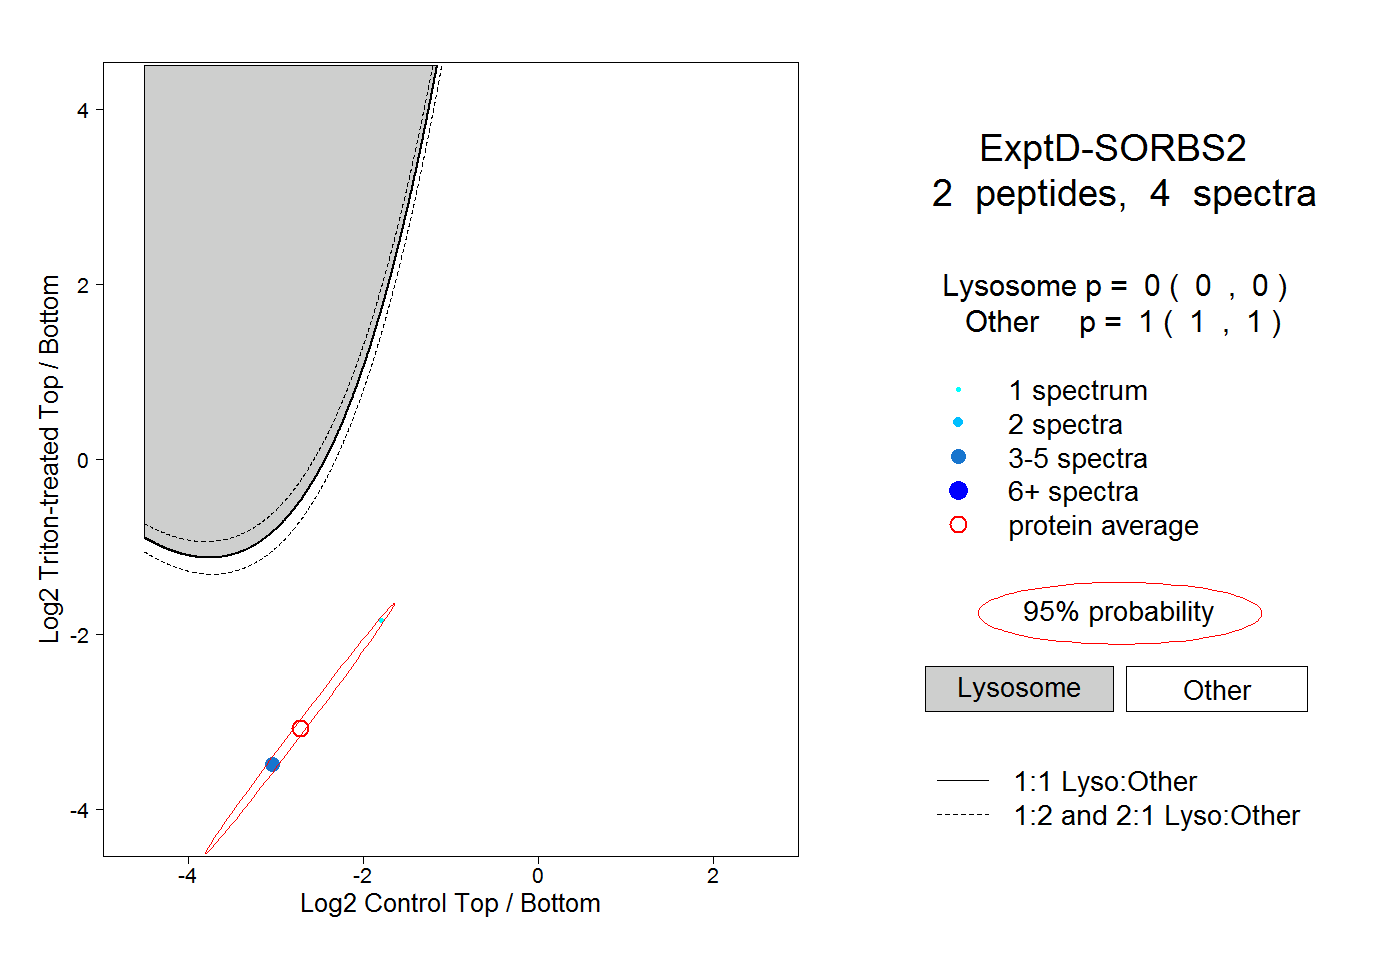
| | | Plot |
|
Lyso |
|
|
|
|
|
|
|
Other |
| Expt D |
2
peptides |
4
spectra |
 |
|
0.000
0.000 | 0.000 |
|
|
|
|
|
|
|
1.000
1.000 | 1.000 |