 5
5peptides
spectra

0.618 | 0.658
0.111 | 0.153
0.000 | 0.000
0.000 | 0.000
0.000 | 0.000
0.190 | 0.254
0.000 | 0.000
0.000 | 0.000
3peptides
spectra
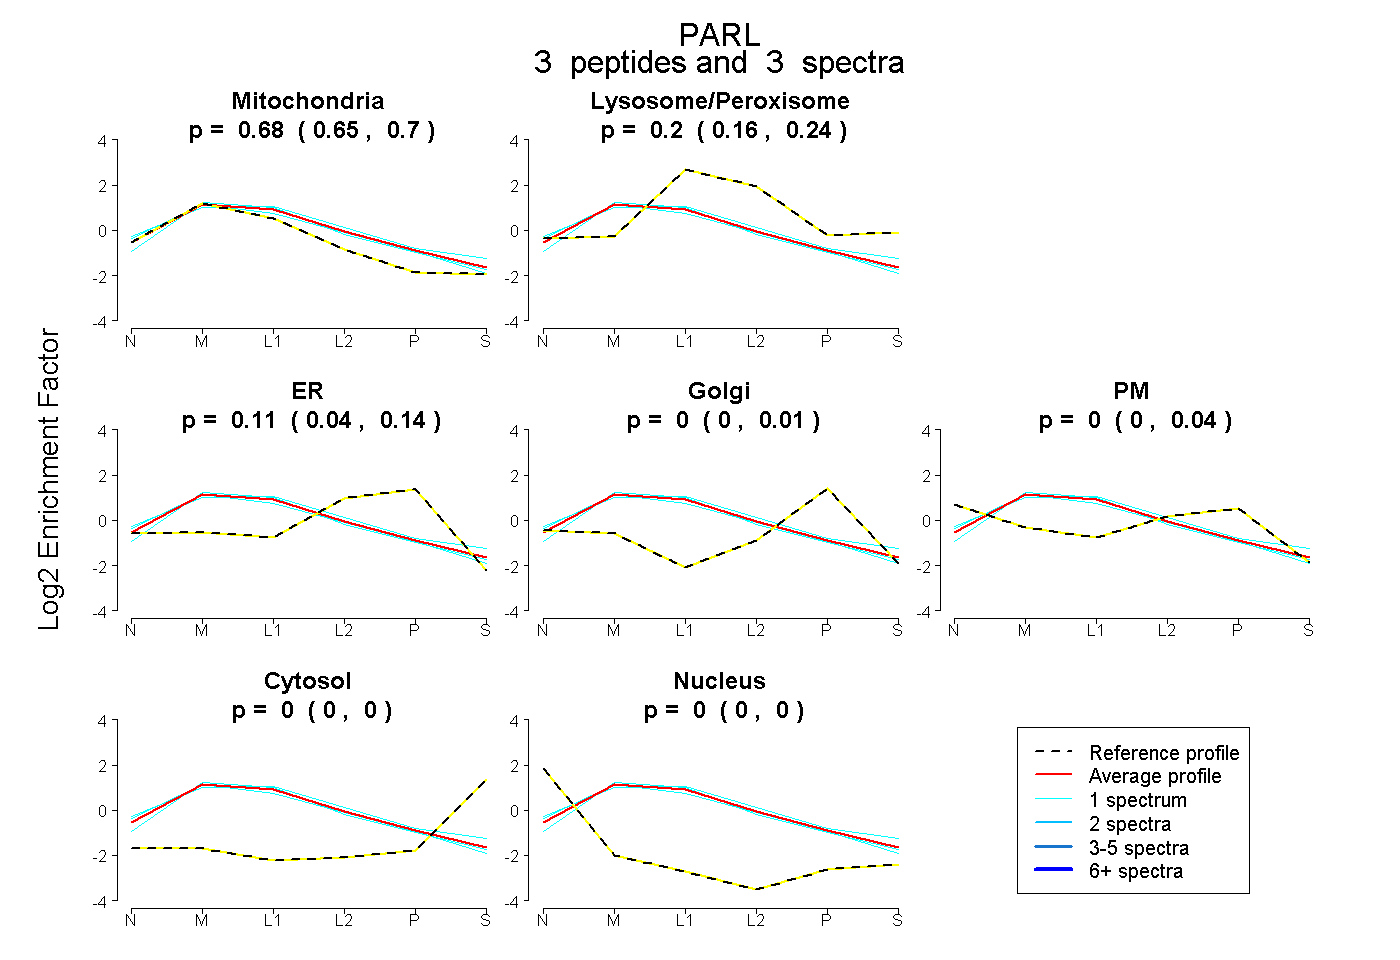
0.652 | 0.703
0.162 | 0.237
0.038 | 0.137
0.000 | 0.009
0.000 | 0.037
0.000 | 0.000
0.000 | 0.000
7peptides
spectra
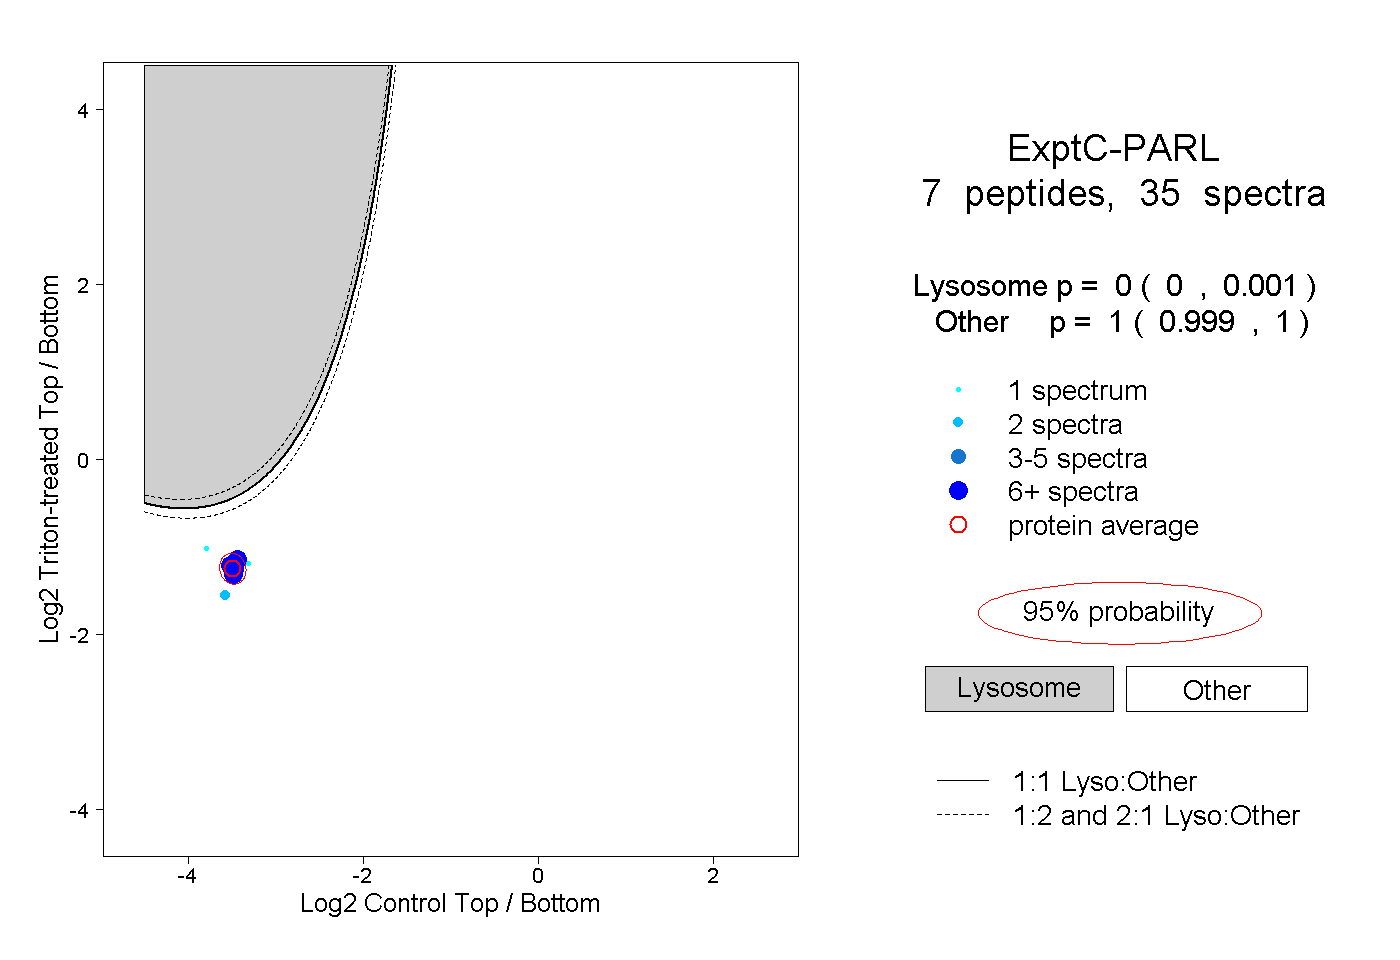
0.000 | 0.001
0.999 | 1.000
2peptides
spectra

0.000 | 0.009
0.990 | 1.000