 31
31peptides
spectra
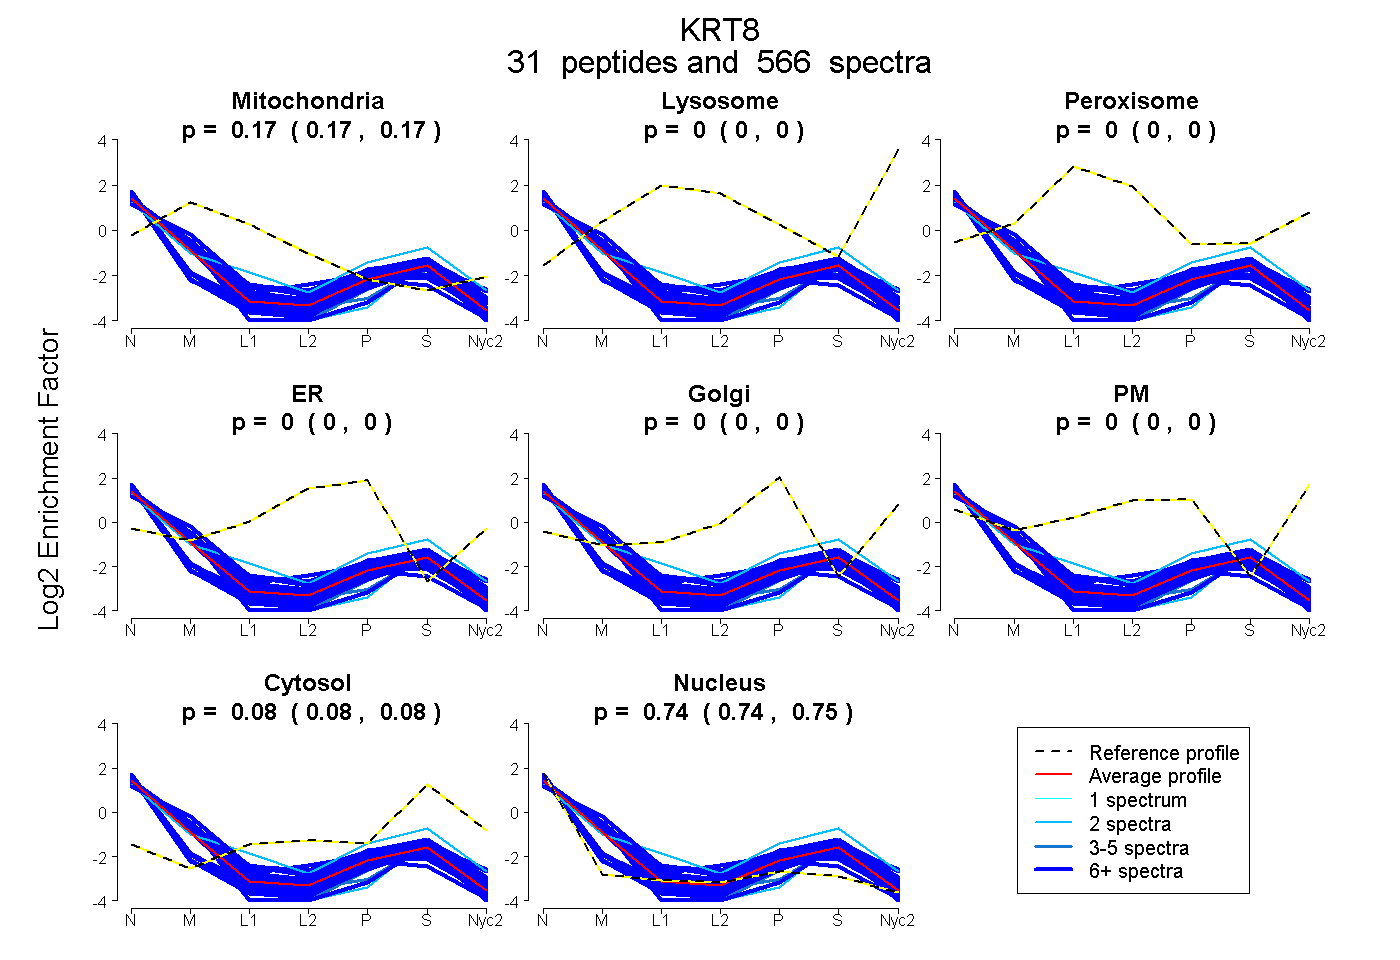
0.170 | 0.173
0.000 | 0.000
0.000 | 0.000
0.000 | 0.000
0.000 | 0.000
0.000 | 0.000
0.083 | 0.084
0.744 | 0.746
23peptides
spectra
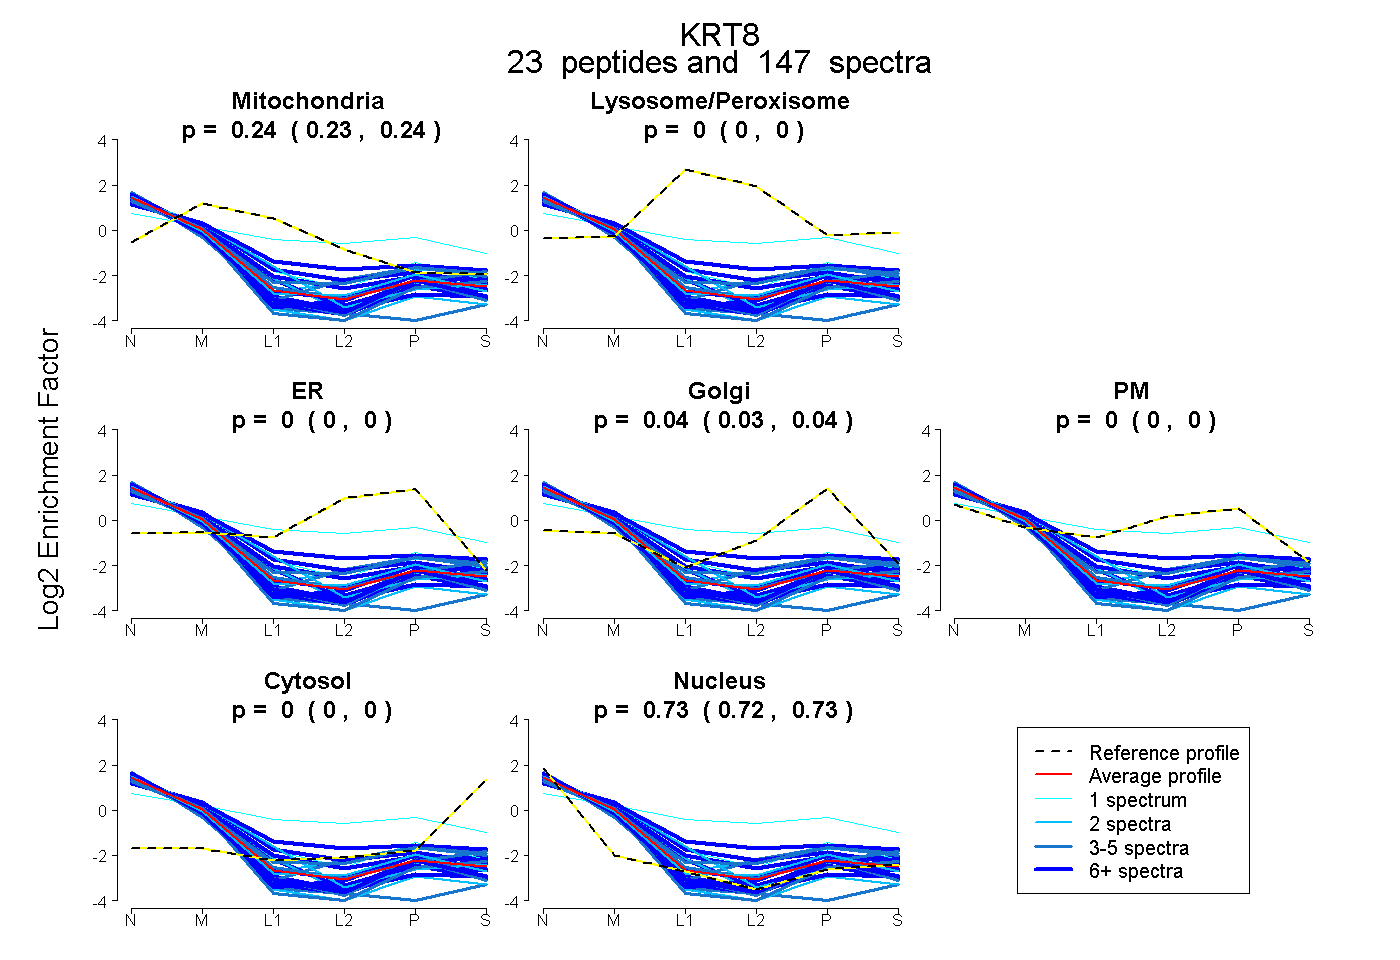
0.231 | 0.239
0.000 | 0.000
0.000 | 0.000
0.033 | 0.042
0.000 | 0.000
0.000 | 0.000
0.723 | 0.730
23peptides
spectra
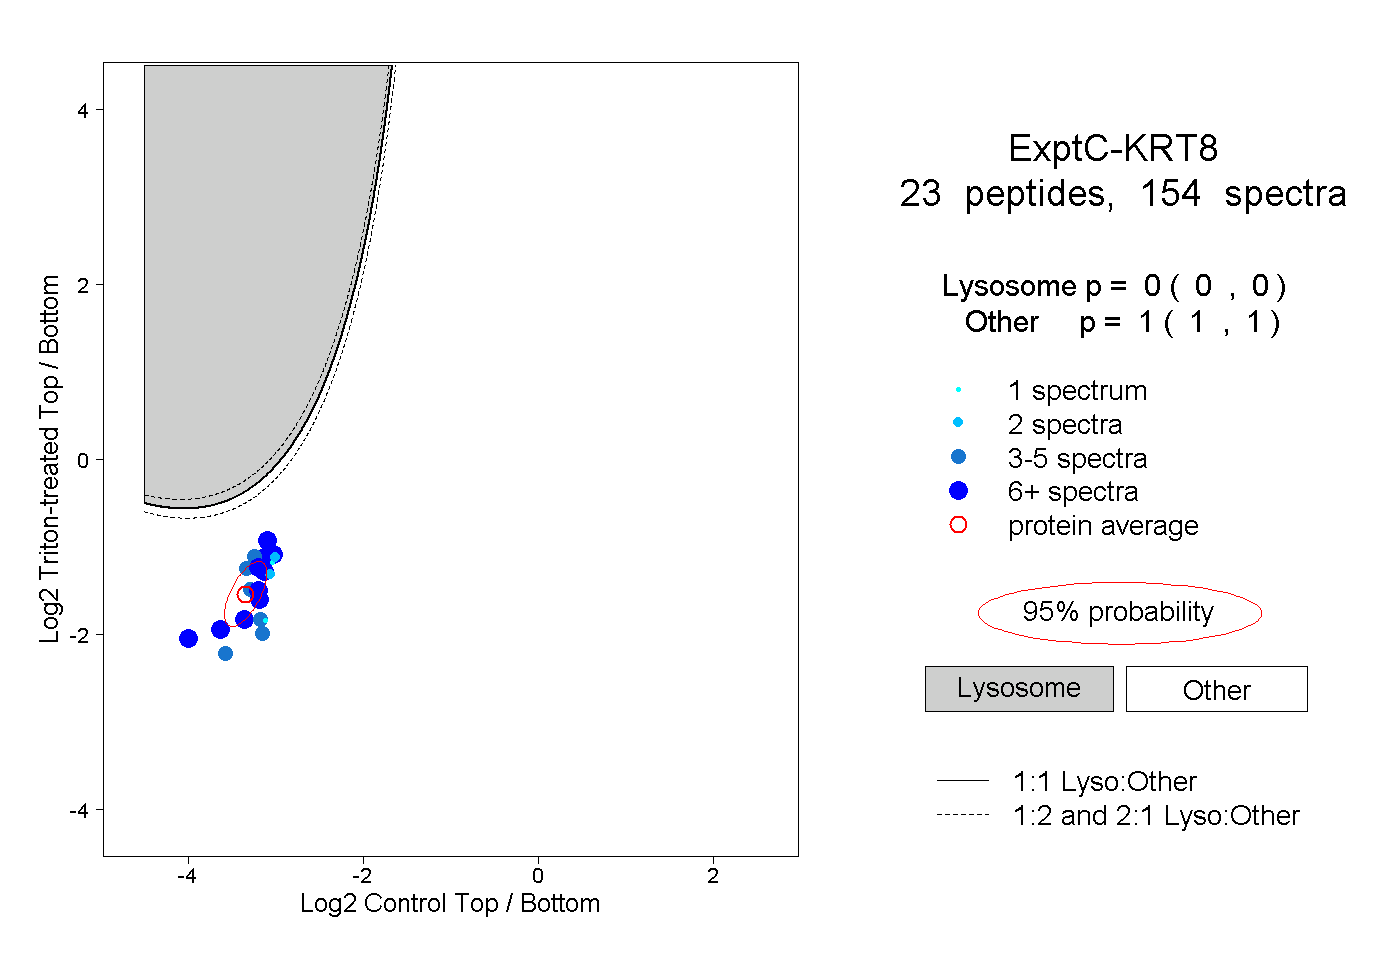
0.000 | 0.000
1.000 | 1.000
8peptides
spectra
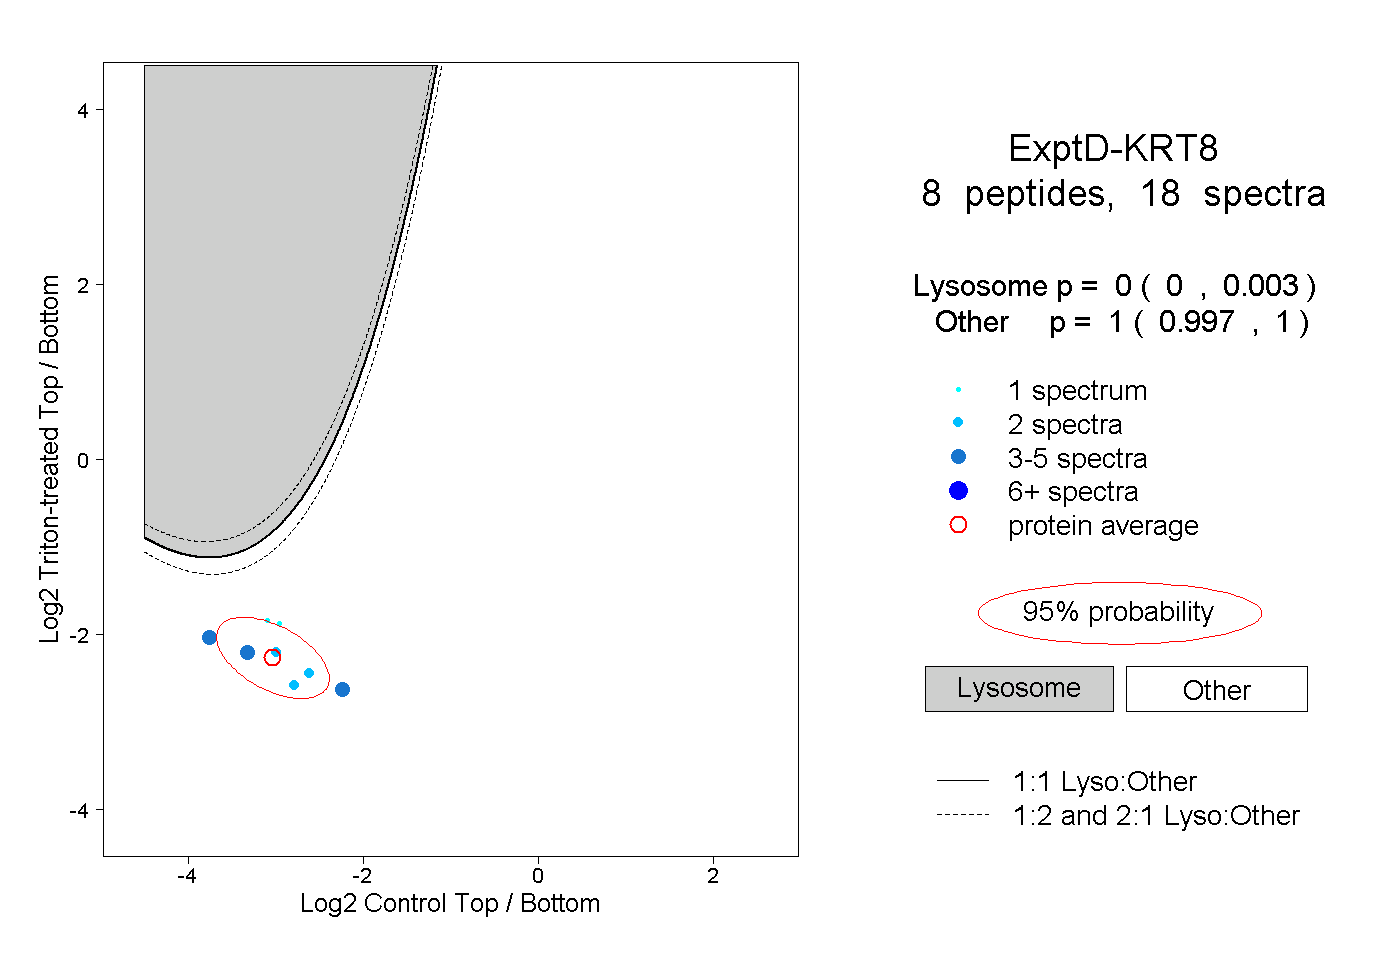
0.000 | 0.003
0.997 | 1.000