KRT8
[ENSRNOP00000029068]
Main page
| | | Plot |
Mito |
Lyso |
|
Perox |
ER |
Golgi |
PM |
Cytosol |
Nucleus |
|
| Expt A |
 31
31
peptides |
566
spectra |
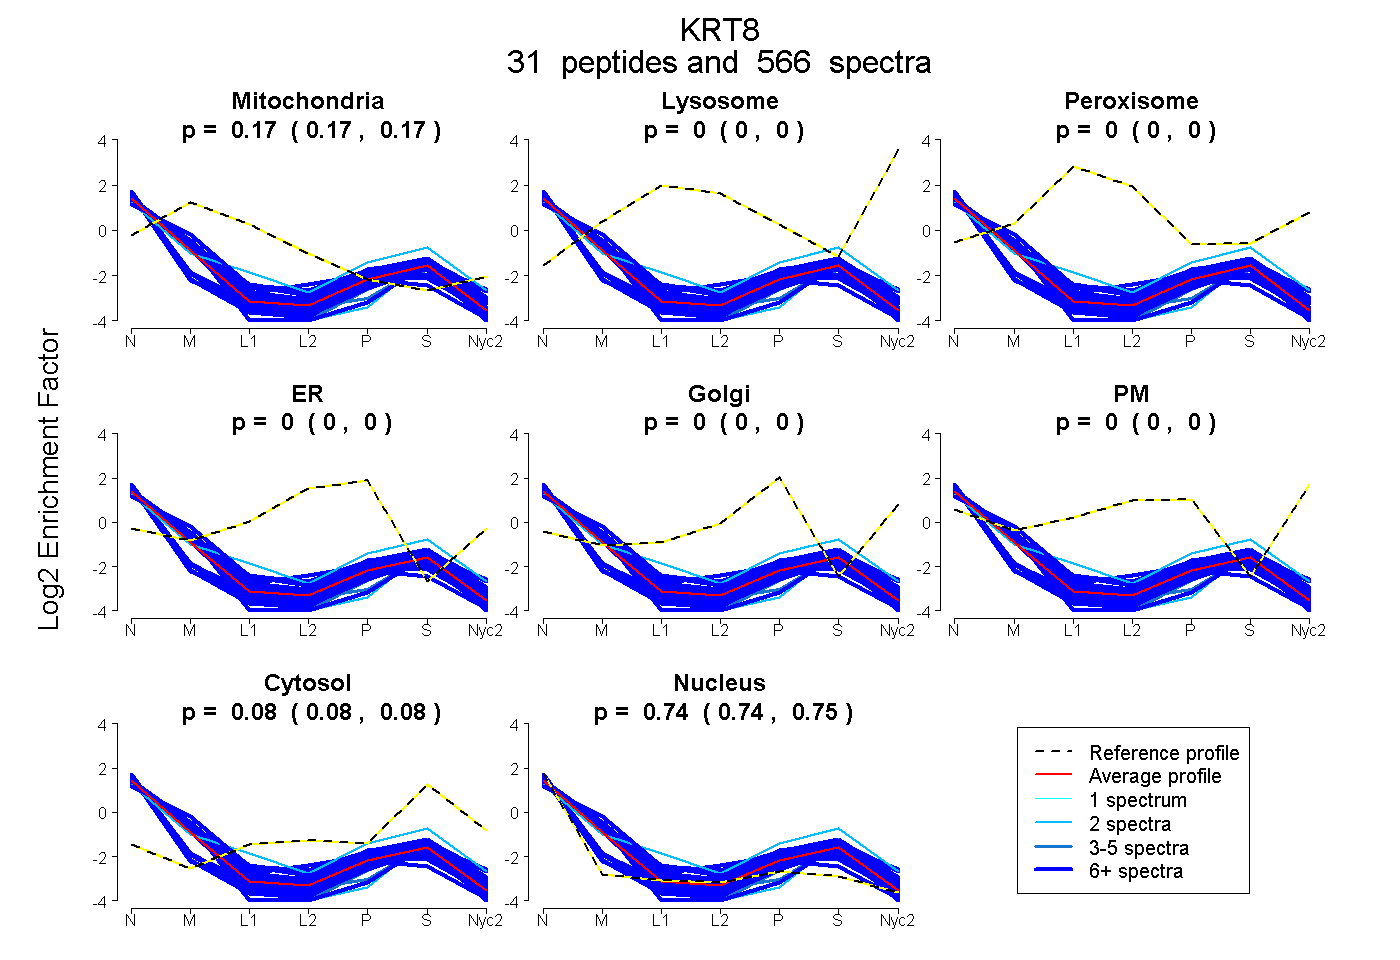 |
0.172
0.170 | 0.173 |
0.000
0.000 | 0.000 |
|
0.000
0.000 | 0.000 |
0.000
0.000 | 0.000 |
0.000
0.000 | 0.000 |
0.000
0.000 | 0.000 |
0.084
0.083 | 0.084 |
0.745
0.744 | 0.746 |
|
| | | Plot |
Mito |
|
Lyso or Perox |
|
ER |
Golgi |
PM |
Cytosol |
Nucleus |
|
| Expt B |
23
peptides |
147
spectra |
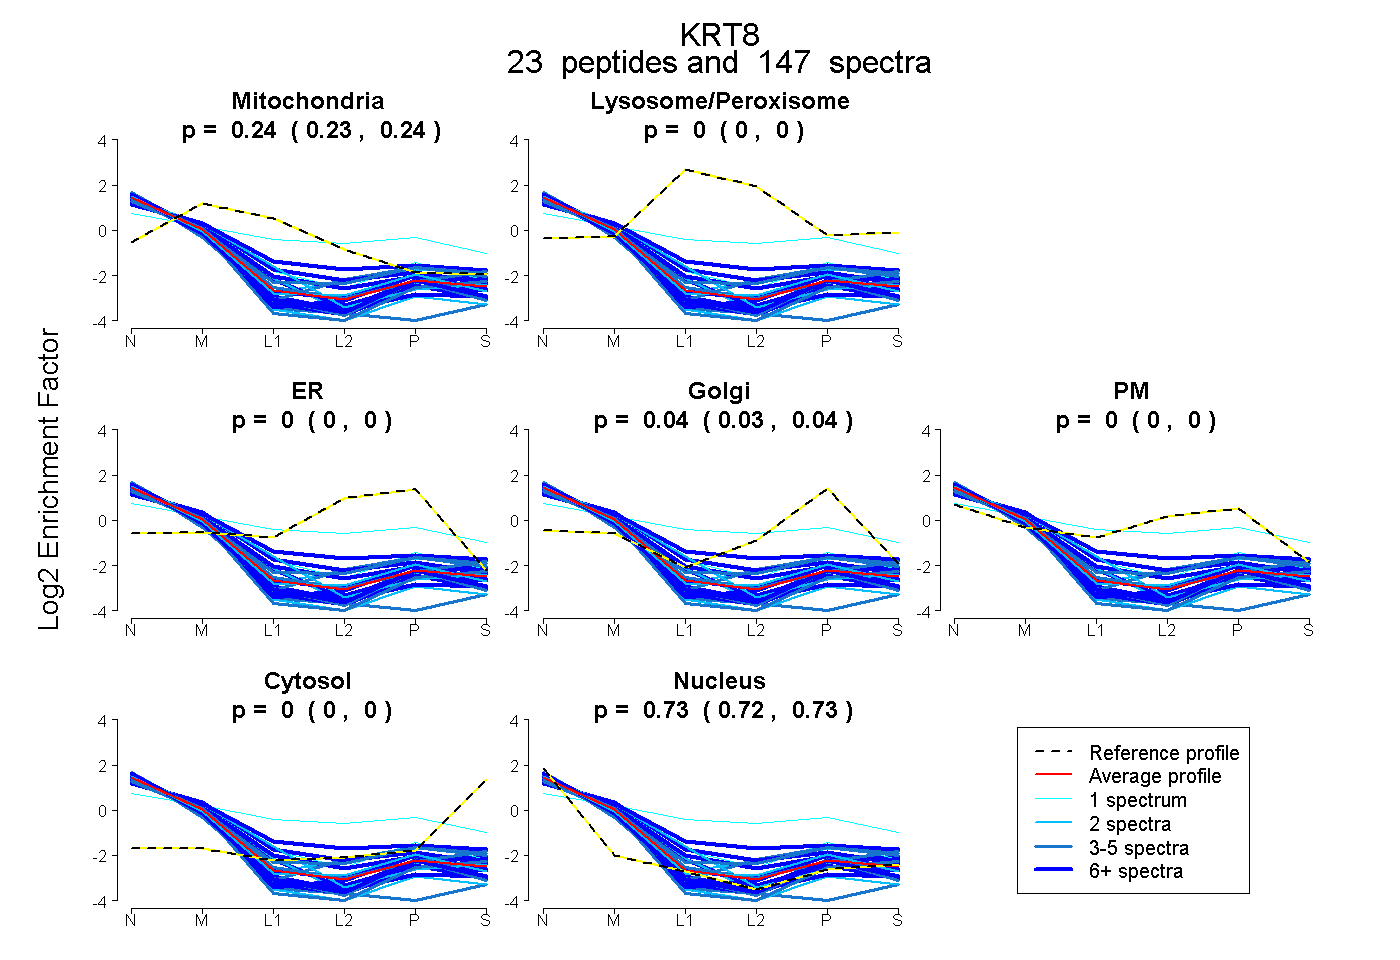 |
0.236
0.231 | 0.239 |
|
0.000
0.000 | 0.000 |
|
0.000
0.000 | 0.000 |
0.038
0.033 | 0.042 |
0.000
0.000 | 0.000 |
0.000
0.000 | 0.000 |
0.727
0.723 | 0.730 |
|
| | | Plot |
|
Lyso |
|
|
|
|
|
|
|
Other |
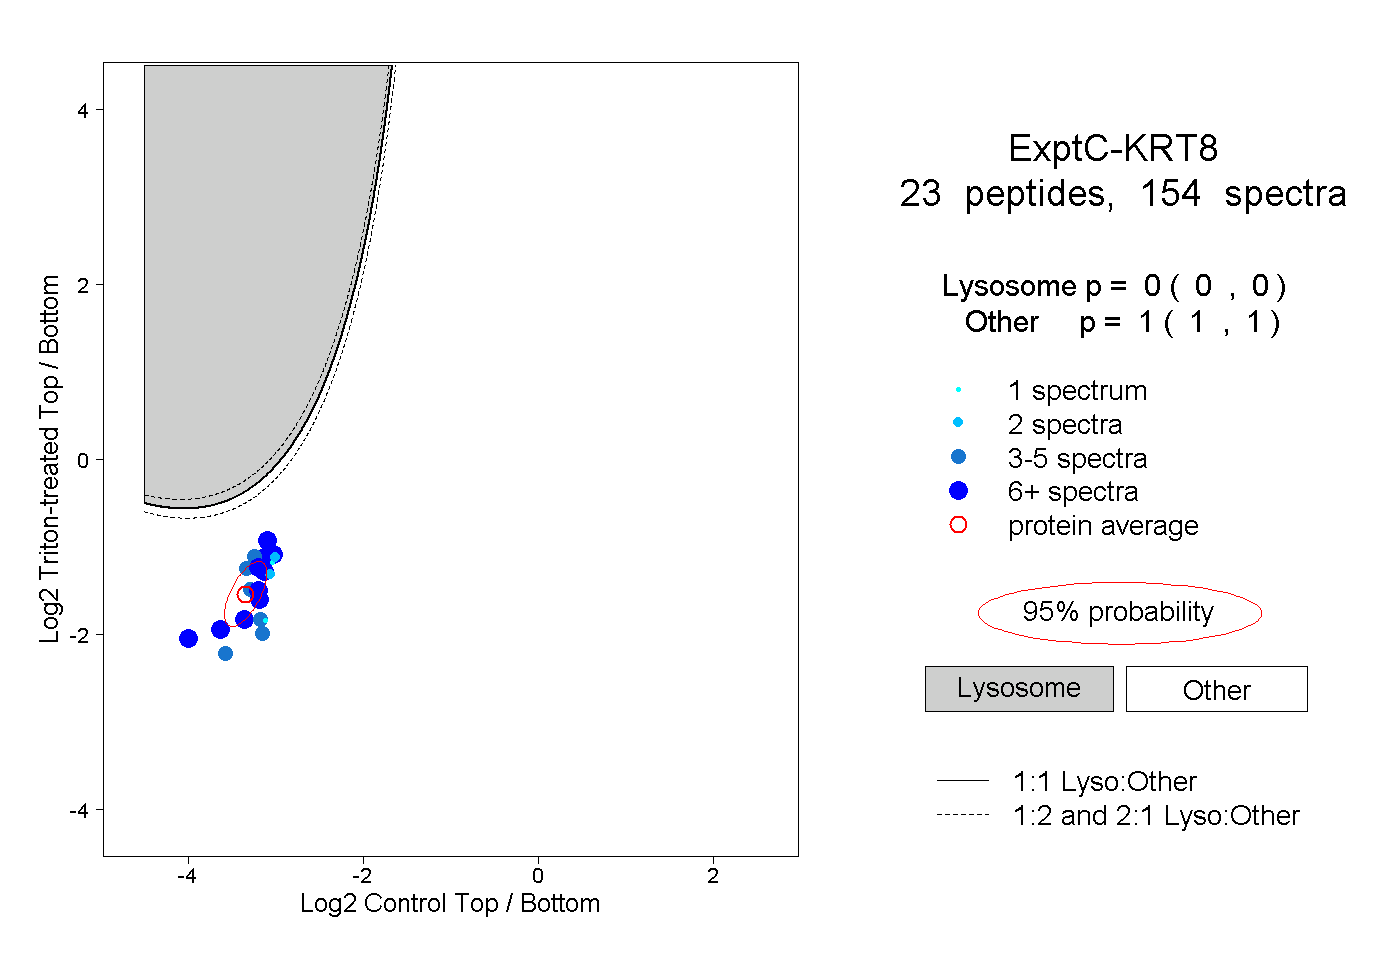
| Expt C |
23
peptides |
154
spectra |
 |
|
0.000
0.000 | 0.000 |
|
|
|
|
|
|
|
1.000
1.000 | 1.000 |
| 7 spectra, AVVVK |
|
0.000 |
|
|
|
|
|
|
|
1.000 |
| 7 spectra, WSLLQQQK |
|
0.000 |
|
|
|
|
|
|
|
1.000 |
| 8 spectra, ISSSSFSR |
|
0.000 |
|
|
|
|
|
|
|
1.000 |
| 3 spectra, TEMENEFVLIK |
|
0.000 |
|
|
|
|
|
|
|
1.000 |
| 9 spectra, LEVDPNIQAVR |
|
0.000 |
|
|
|
|
|
|
|
1.000 |
| 15 spectra, FLEQQNK |
|
0.000 |
|
|
|
|
|
|
|
1.000 |
| 2 spectra, AEAETMYQIK |
|
0.000 |
|
|
|
|
|
|
|
1.000 |
| 29 spectra, AQYEEIANR |
|
0.000 |
|
|
|
|
|
|
|
1.000 |
| 1 spectrum, MSTSGPR |
|
0.000 |
|
|
|
|
|
|
|
1.000 |
| 6 spectra, TEISEMNR |
|
0.000 |
|
|
|
|
|
|
|
1.000 |
| 7 spectra, QIHEEEIR |
|
0.000 |
|
|
|
|
|
|
|
1.000 |
| 5 spectra, SFTSGPGAR |
|
0.000 |
|
|
|
|
|
|
|
1.000 |
| 7 spectra, LQAEIDALK |
|
0.000 |
|
|
|
|
|
|
|
1.000 |
| 1 spectrum, VELESR |
|
0.000 |
|
|
|
|
|
|
|
1.000 |
| 9 spectra, VGSSSSSFR |
|
0.001 |
|
|
|
|
|
|
|
0.999 |
| 4 spectra, QLEALGQEK |
|
0.000 |
|
|
|
|
|
|
|
1.000 |
| 2 spectra, EYQELMNVK |
|
0.000 |
|
|
|
|
|
|
|
1.000 |
| 10 spectra, SLDMDSIIAEVR |
|
0.000 |
|
|
|
|
|
|
|
1.000 |
| 2 spectra, YEELQTLAGK |
|
0.000 |
|
|
|
|
|
|
|
1.000 |
| 5 spectra, LEGLTDEINFLR |
|
0.000 |
|
|
|
|
|
|
|
1.000 |
| 3 spectra, LVSESSDIMSK |
|
0.000 |
|
|
|
|
|
|
|
1.000 |
| 8 spectra, DVDEAYMNK |
|
0.000 |
|
|
|
|
|
|
|
1.000 |
| 4 spectra, LLEGEESR |
|
0.000 |
|
|
|
|
|
|
|
1.000 |
| | | Plot |
|
Lyso |
|
|
|
|
|
|
|
Other |
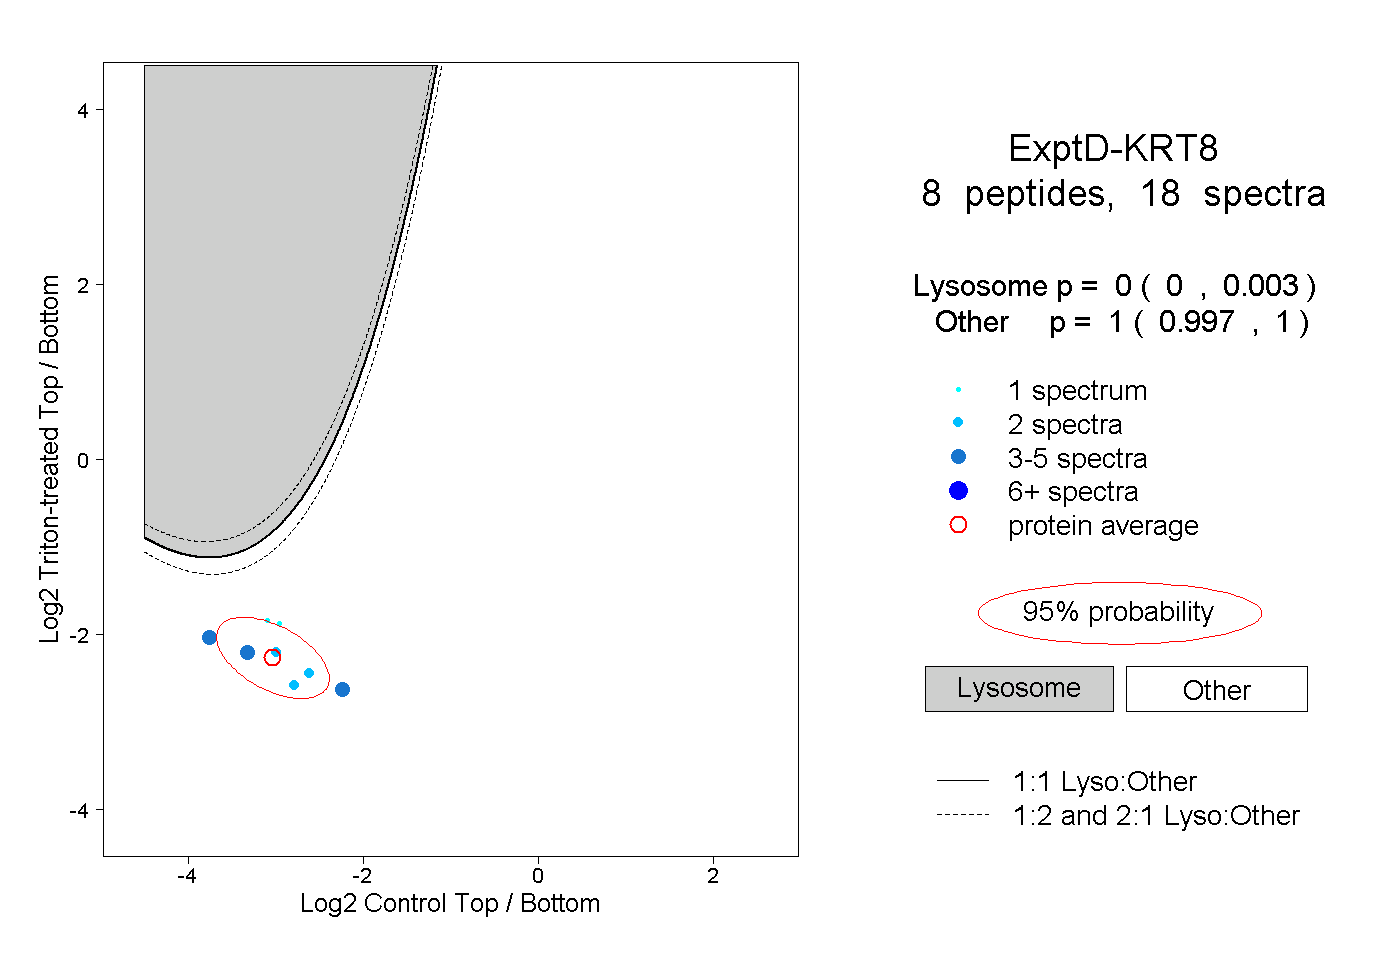
| Expt D |
8
peptides |
18
spectra |
 |
|
0.000
0.000 | 0.003 |
|
|
|
|
|
|
|
1.000
0.997 | 1.000 |