 3
3peptides
spectra
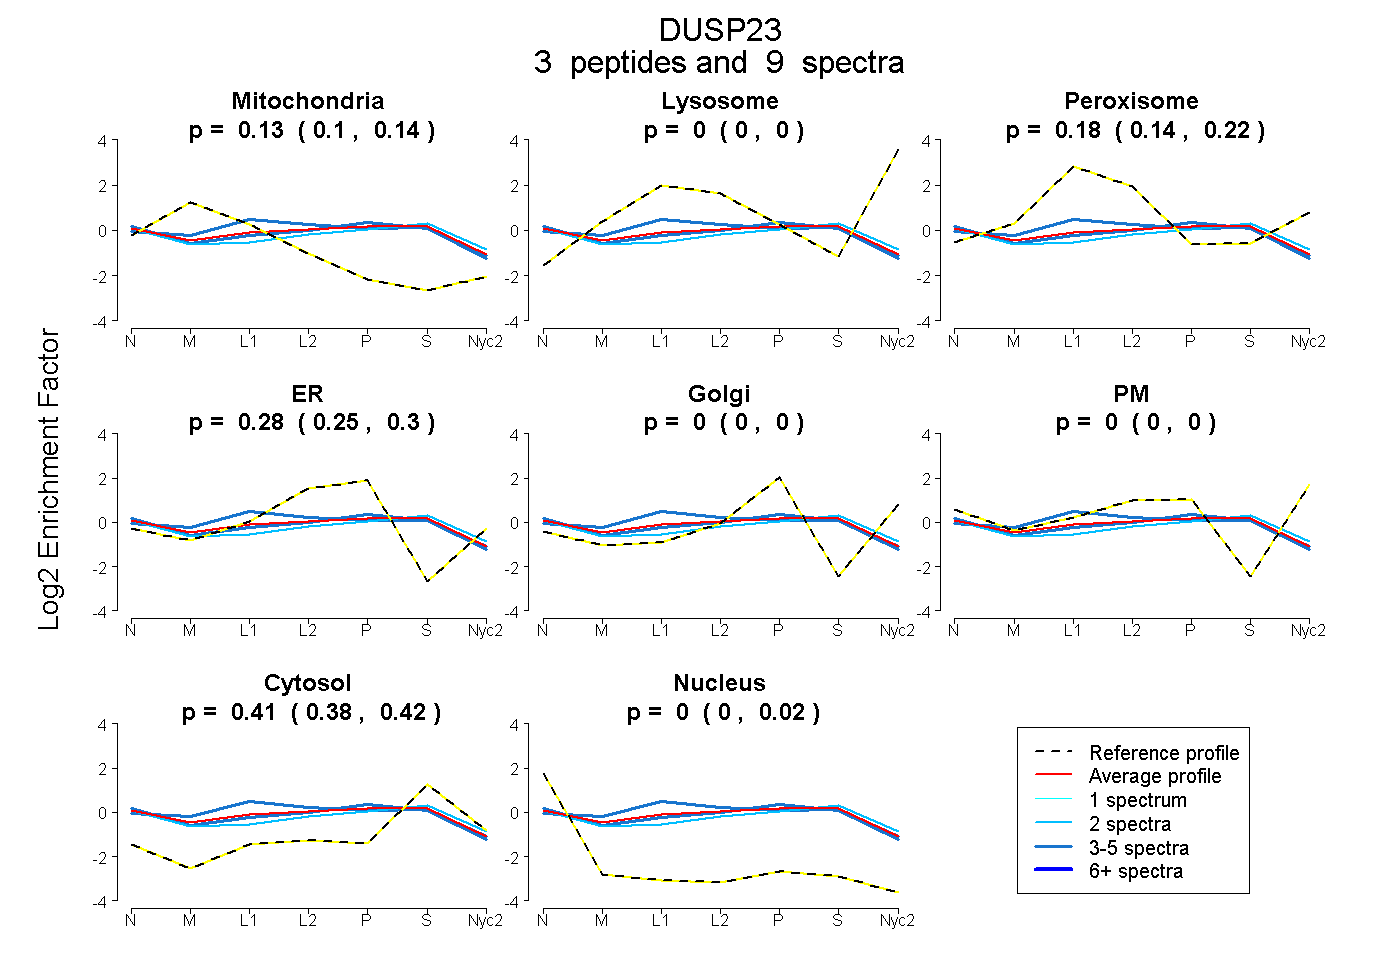
0.099 | 0.143
0.000 | 0.000
0.142 | 0.218
0.255 | 0.300
0.000 | 0.000
0.000 | 0.000
0.384 | 0.422
0.000 | 0.021
3peptides
spectra
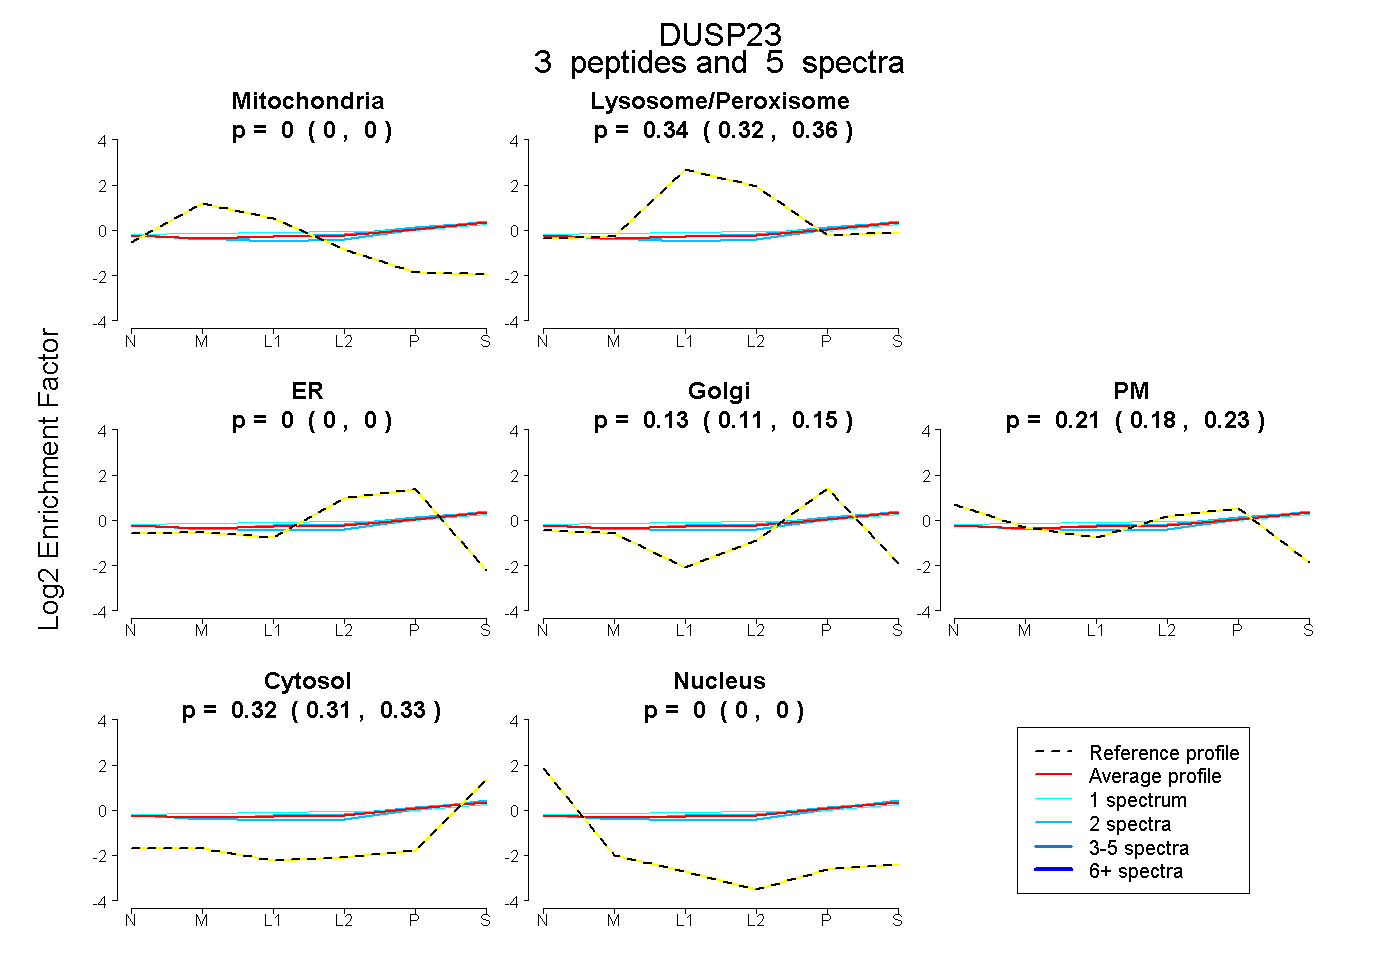
0.000 | 0.000
0.322 | 0.357
0.000 | 0.000
0.114 | 0.149
0.185 | 0.229
0.306 | 0.327
0.000 | 0.000
3peptides
spectra
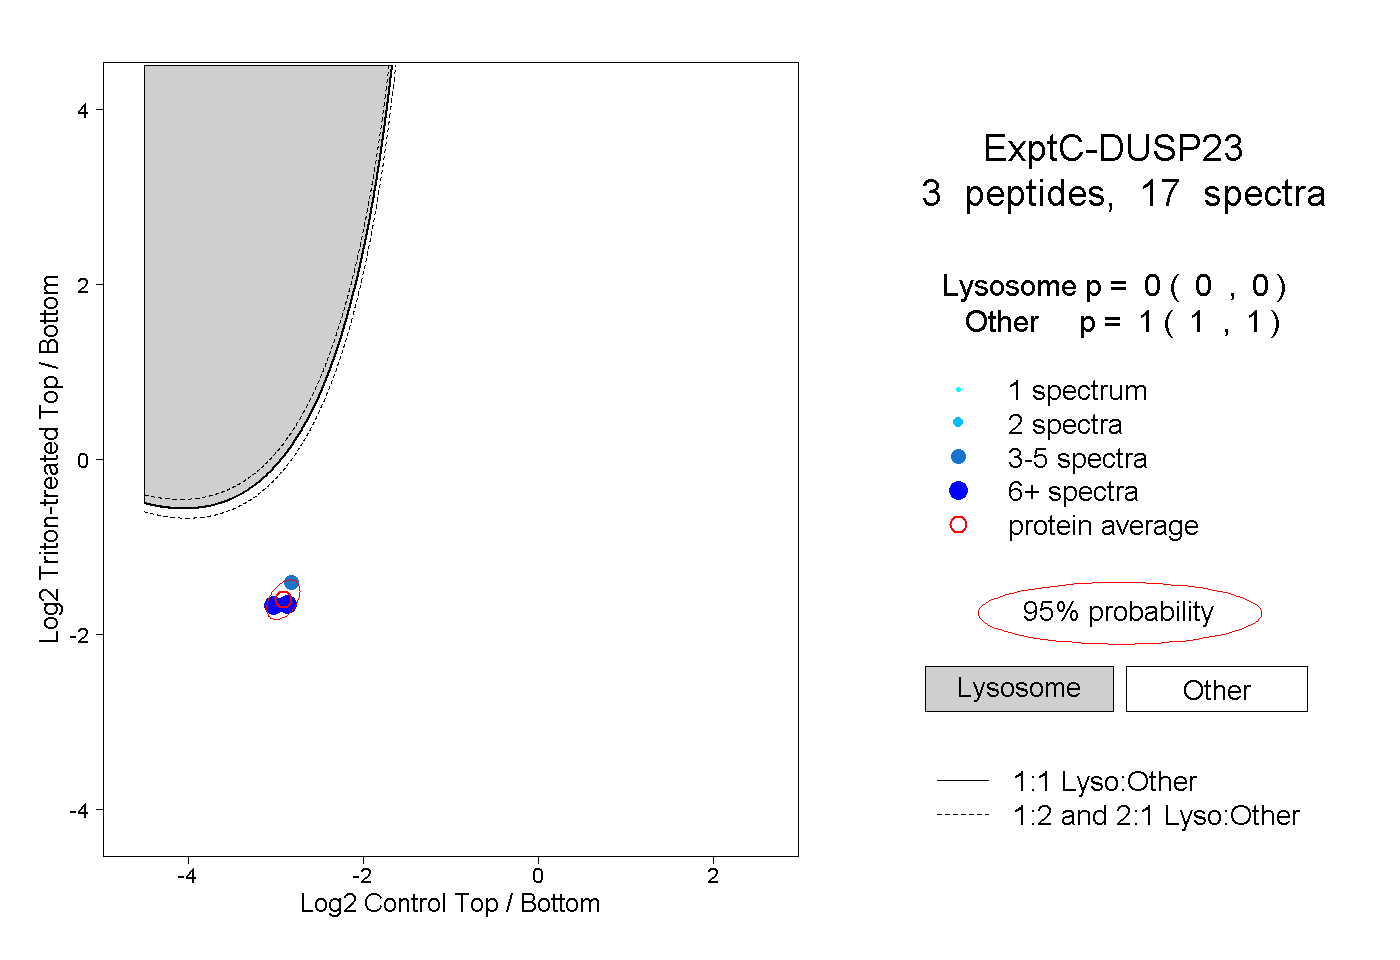
0.000 | 0.000
1.000 | 1.000