 3
3peptides
spectra
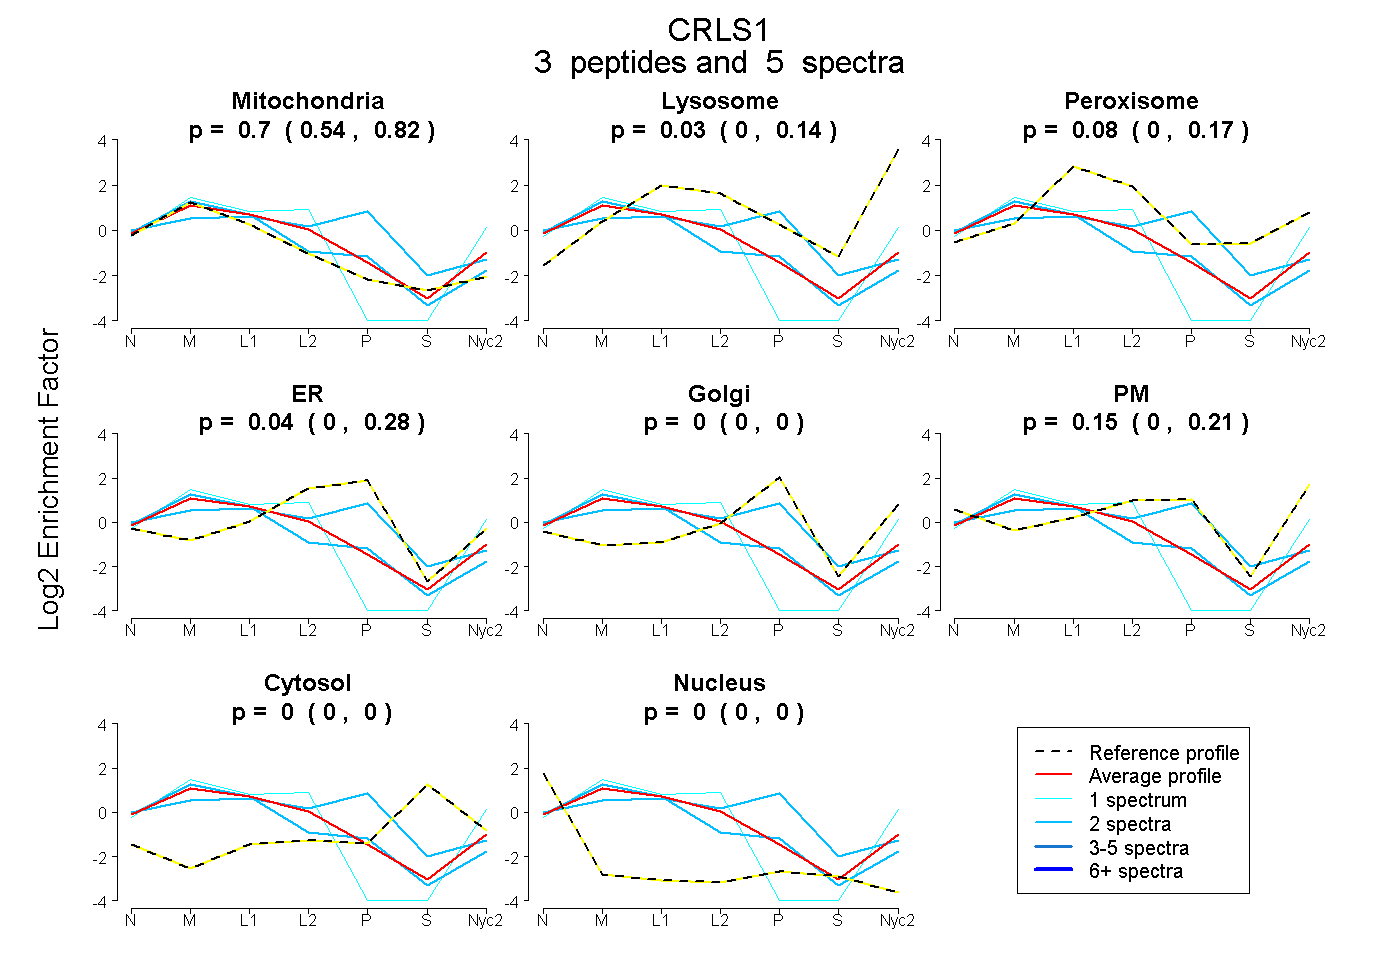
0.544 | 0.822
0.000 | 0.137
0.000 | 0.167
0.000 | 0.284
0.000 | 0.000
0.000 | 0.212
0.000 | 0.000
0.000 | 0.000
6peptides
spectra
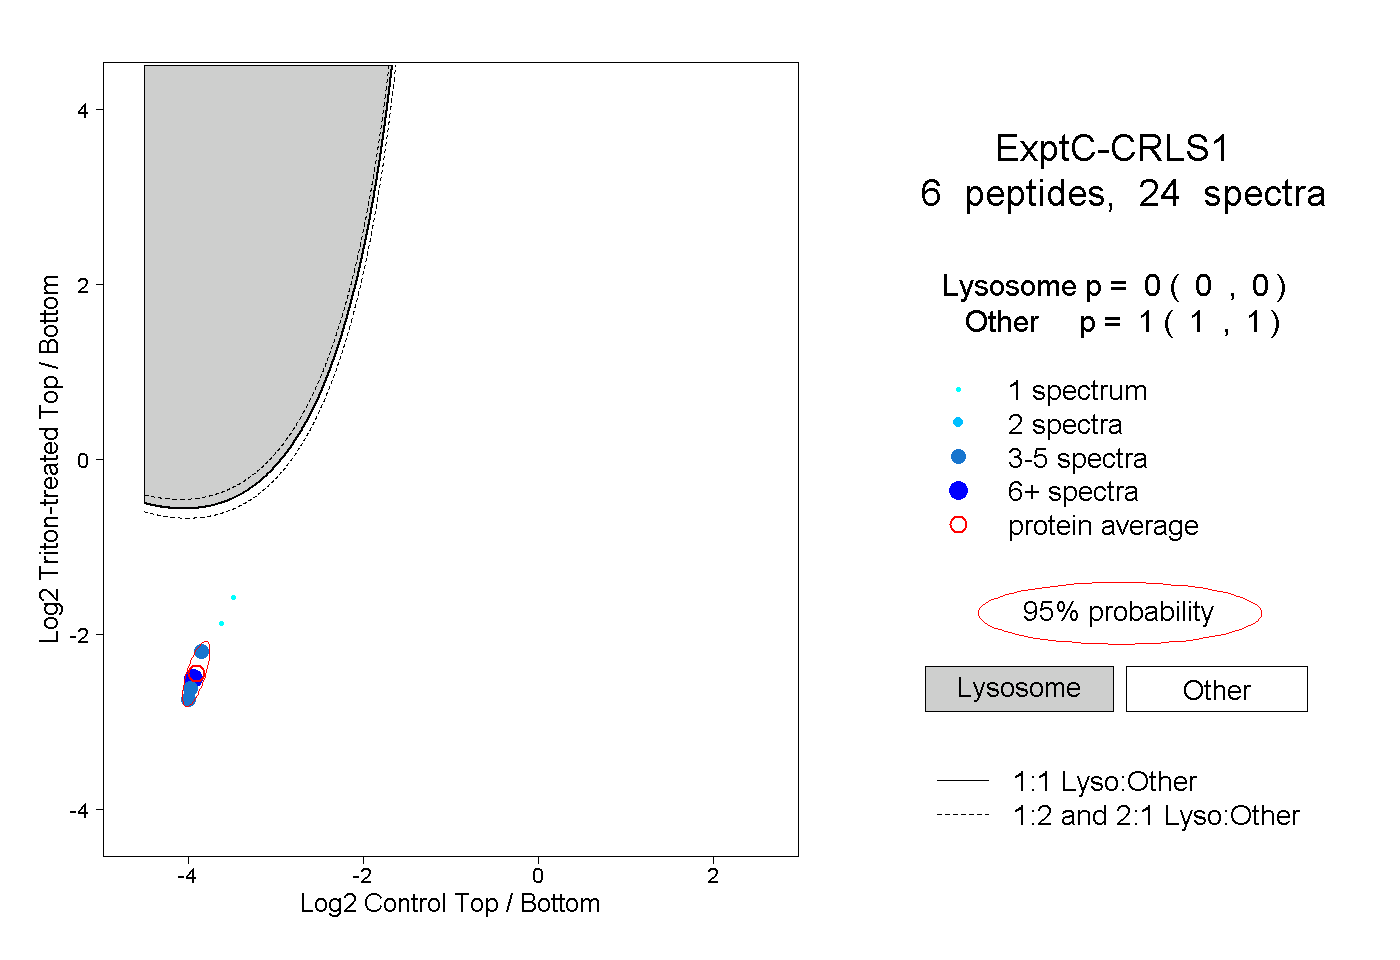
0.000 | 0.000
1.000 | 1.000
2peptides
spectra
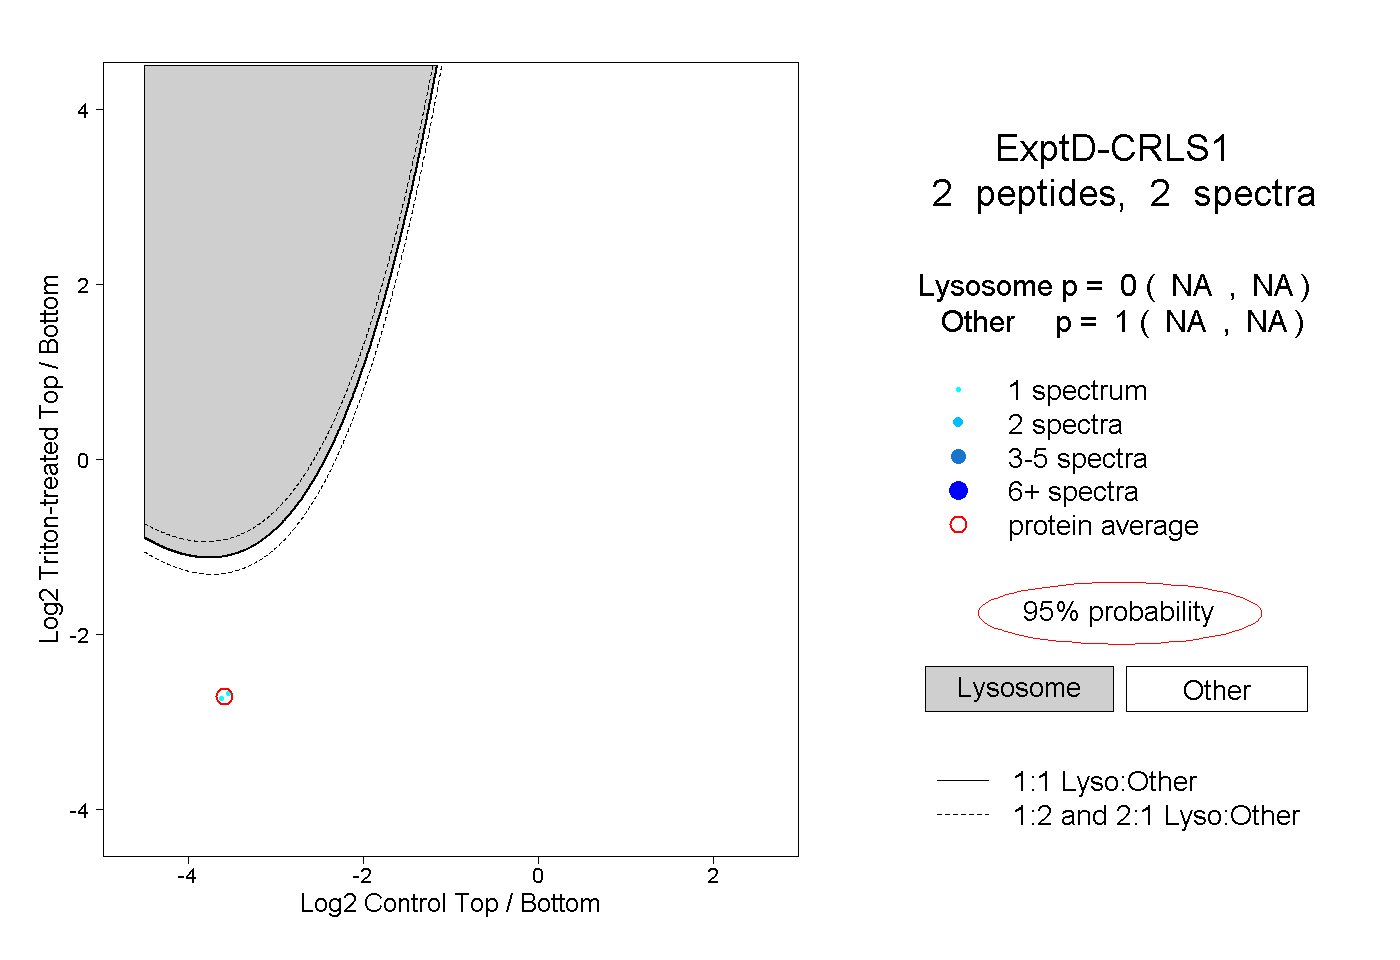
NA | NA
NA | NA