 3
3peptides
spectra
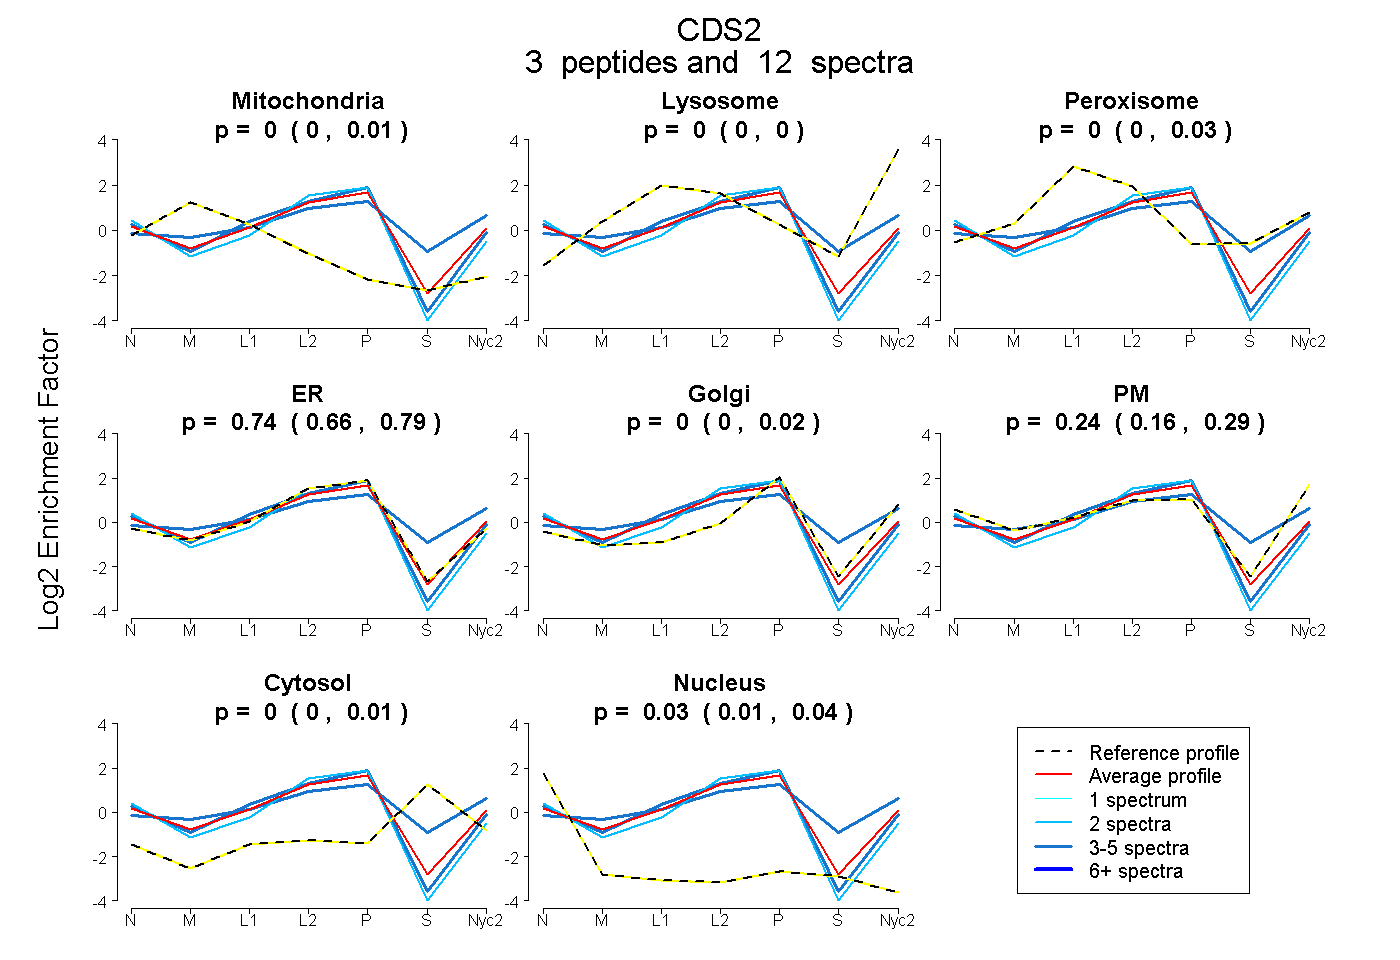
0.000 | 0.010
0.000 | 0.000
0.000 | 0.025
0.665 | 0.793
0.000 | 0.017
0.157 | 0.289
0.000 | 0.014
0.006 | 0.040
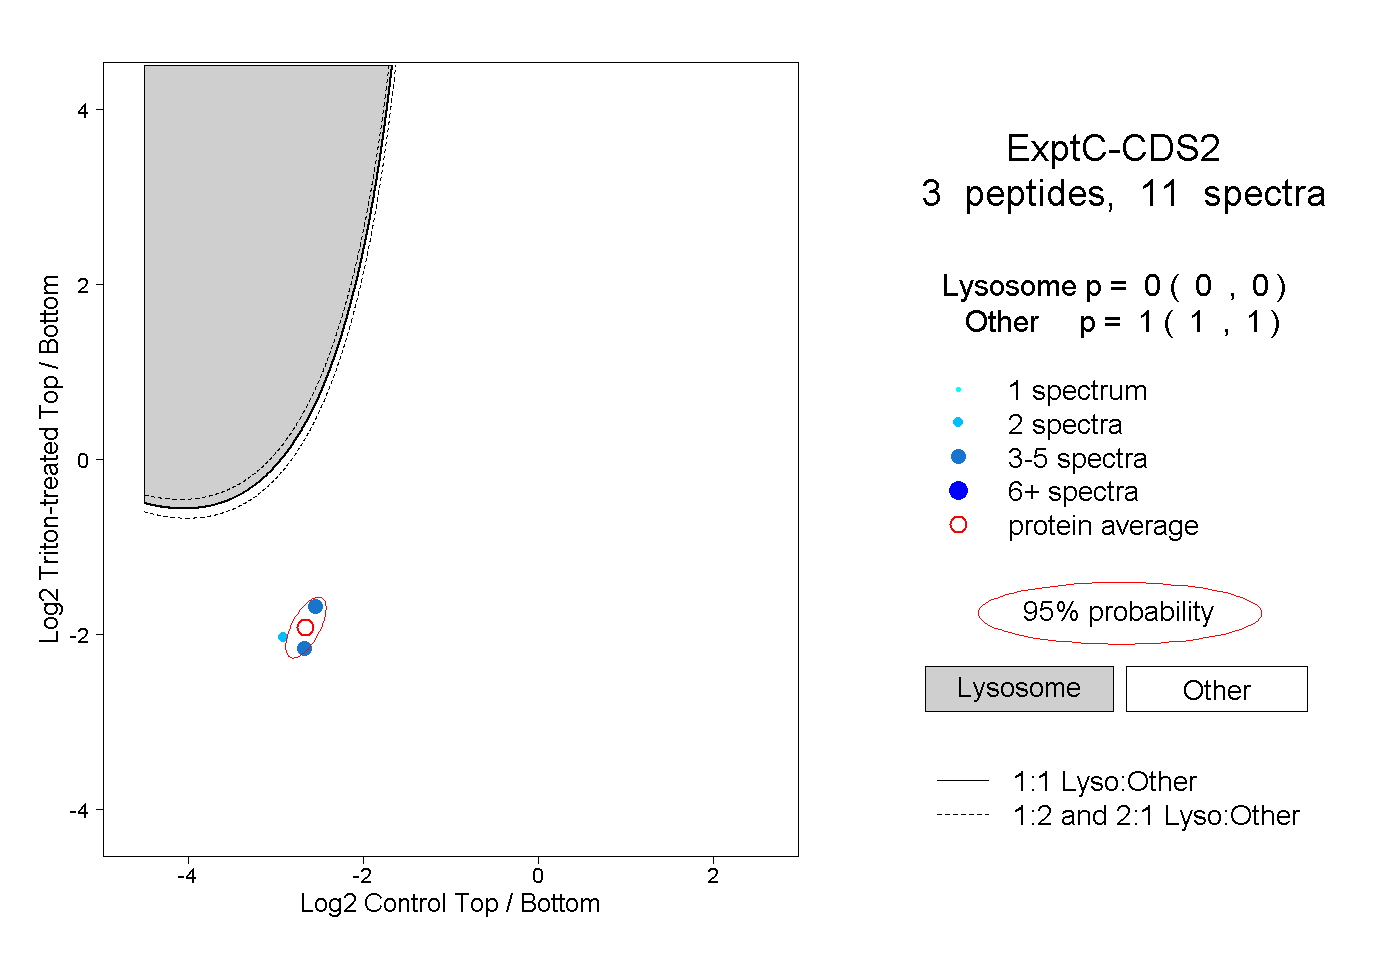
1peptide
spectra

0.000 | 0.000
0.000 | 0.000
0.598 | 0.652
0.335 | 0.397
0.000 | 0.000
0.000 | 0.000
0.000 | 0.011
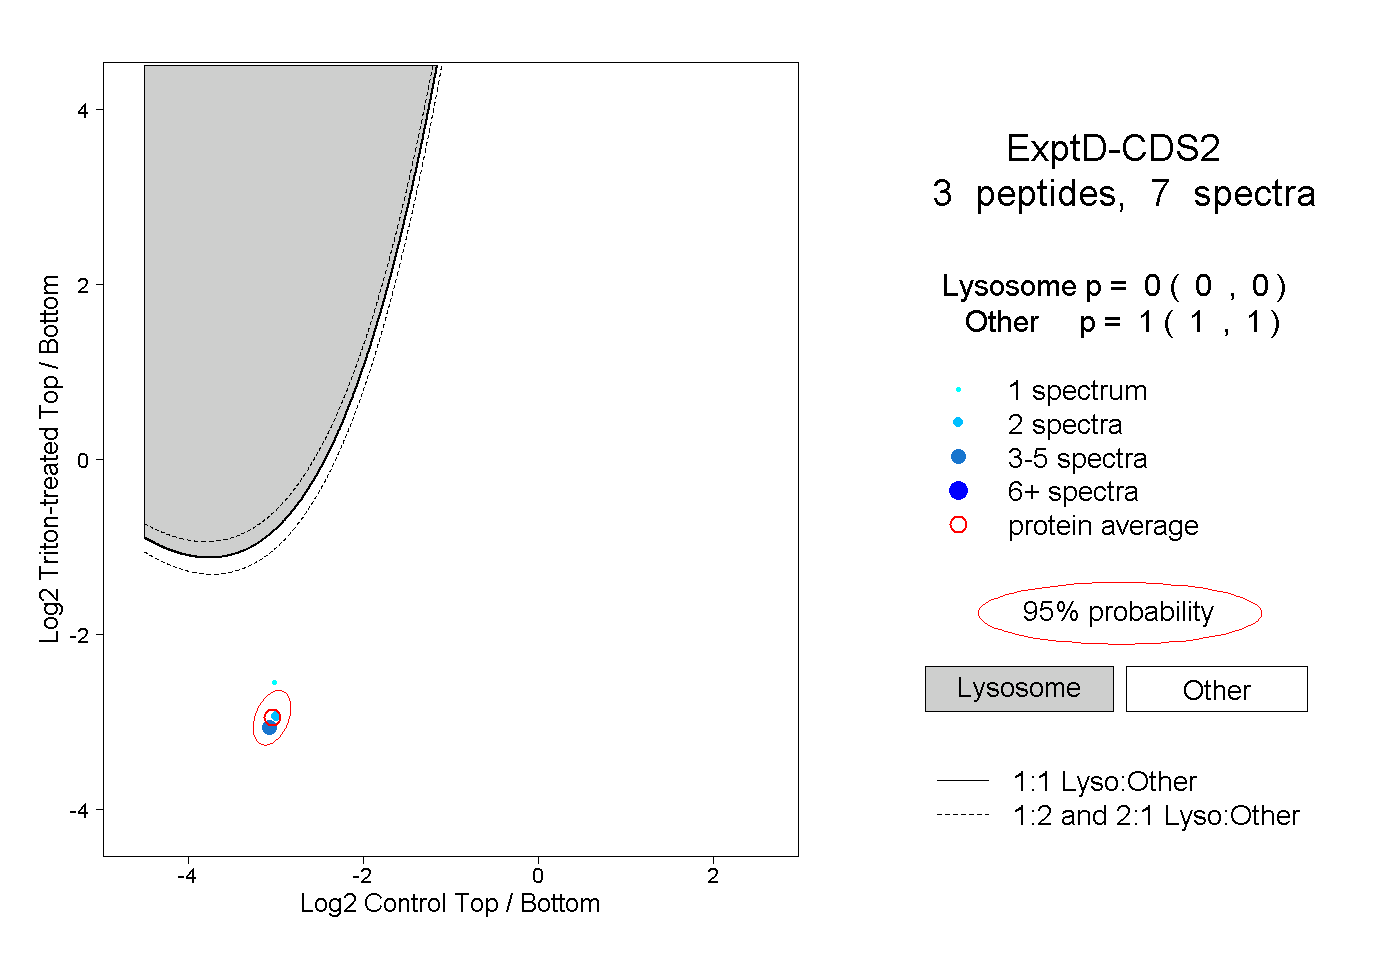
3peptides
spectra
0.000 | 0.000
1.000 | 1.000
3peptides
spectra
0.000 | 0.000
1.000 | 1.000