19
19peptides
spectra
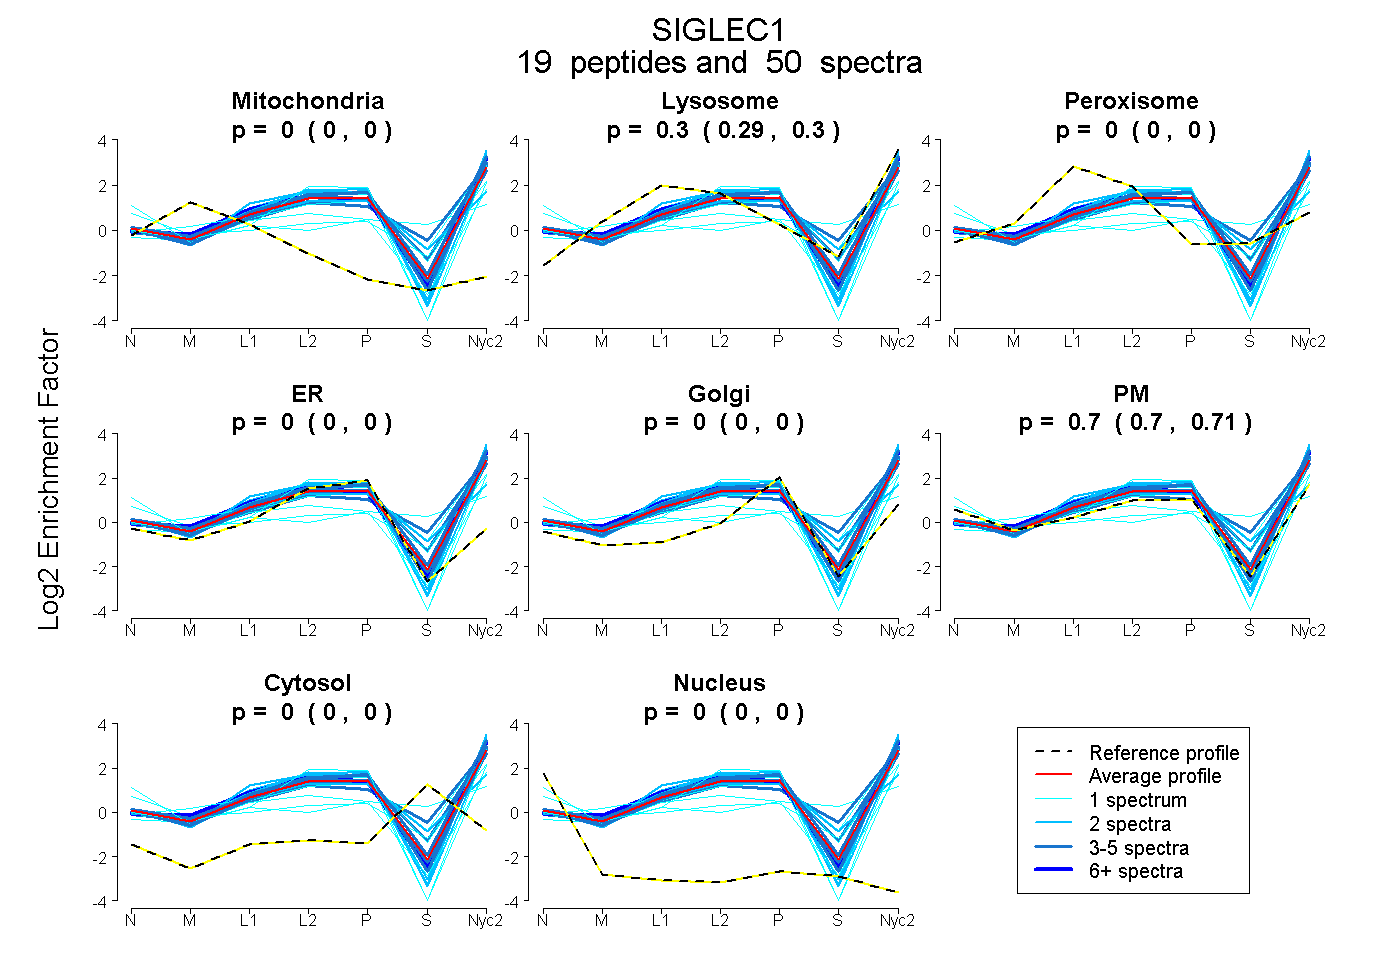
0.000 | 0.000
0.288 | 0.303
0.000 | 0.000
0.000 | 0.000
0.000 | 0.000
0.696 | 0.711
0.000 | 0.000
0.000 | 0.000
2peptides
spectra
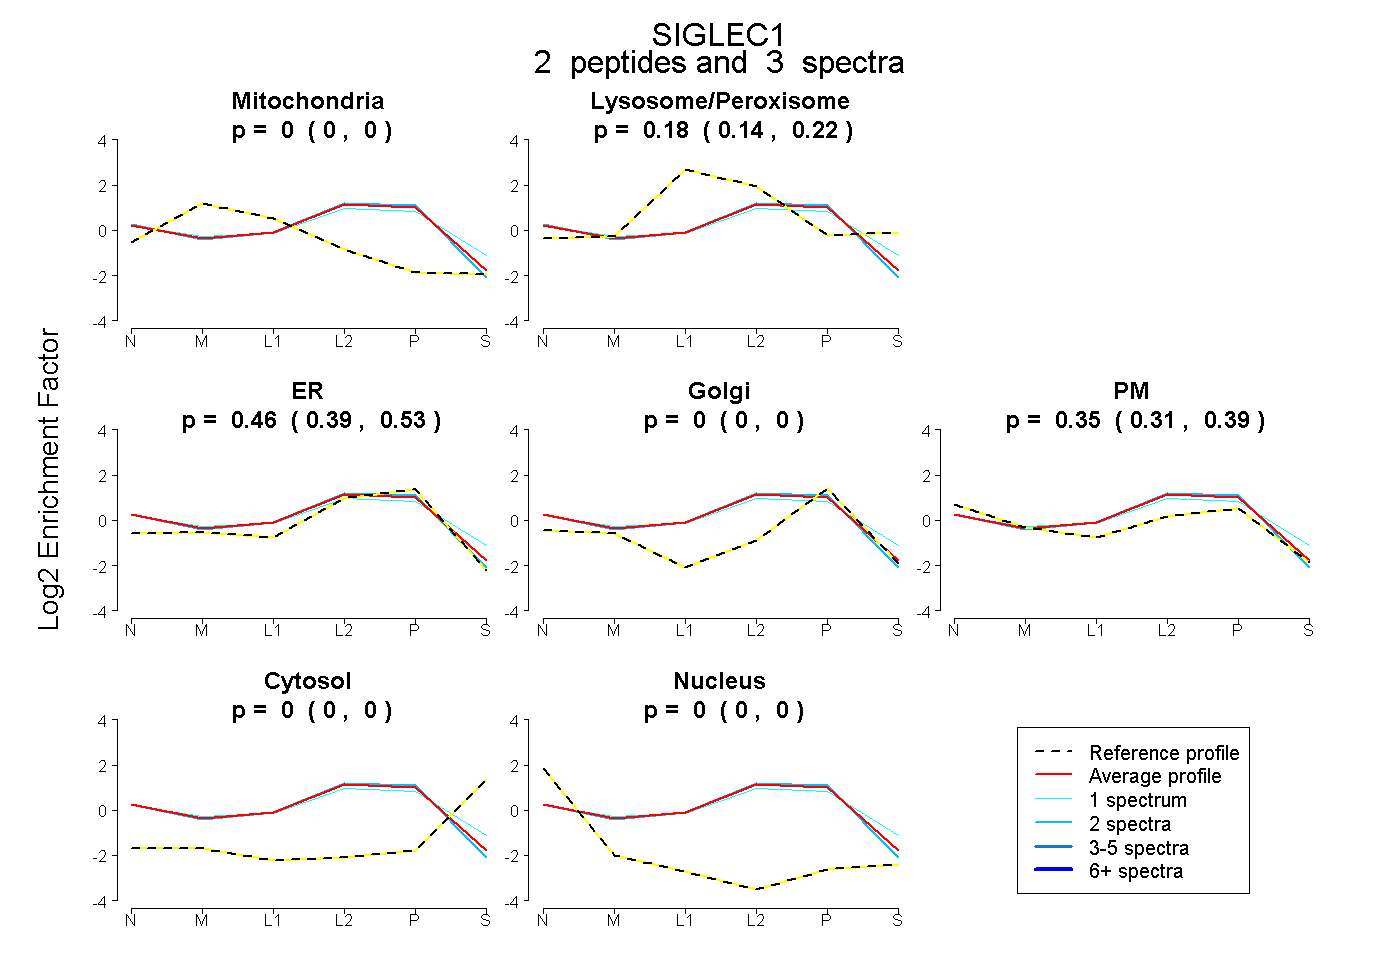
0.000 | 0.000
0.138 | 0.220
0.386 | 0.528
0.000 | 0.000
0.313 | 0.393
0.000 | 0.000
0.000 | 0.000
21peptides
spectra
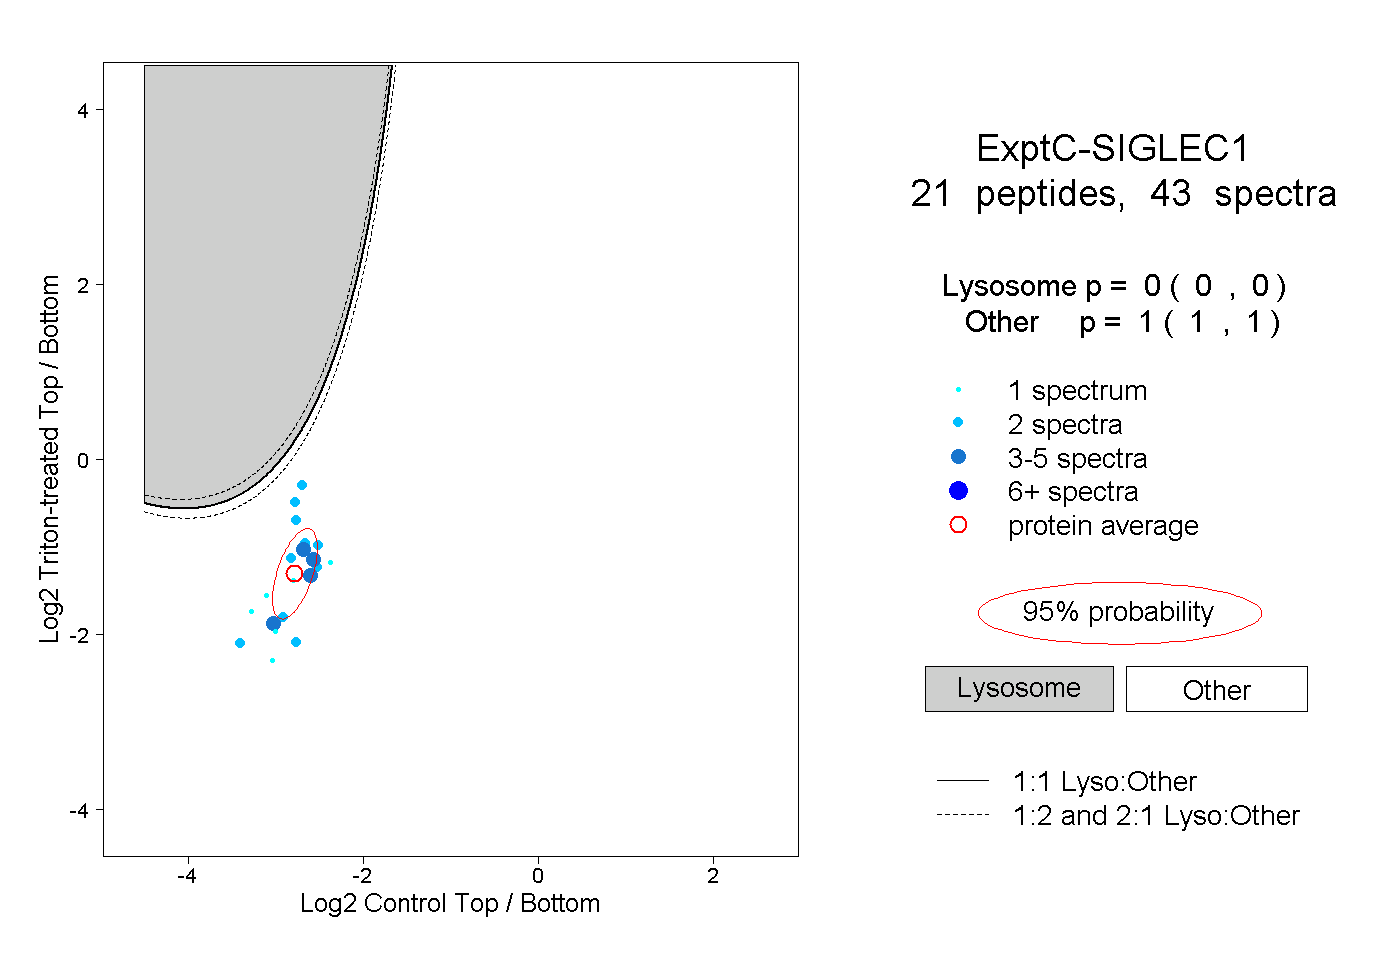
0.000 | 0.000
1.000 | 1.000