17
17peptides
spectra
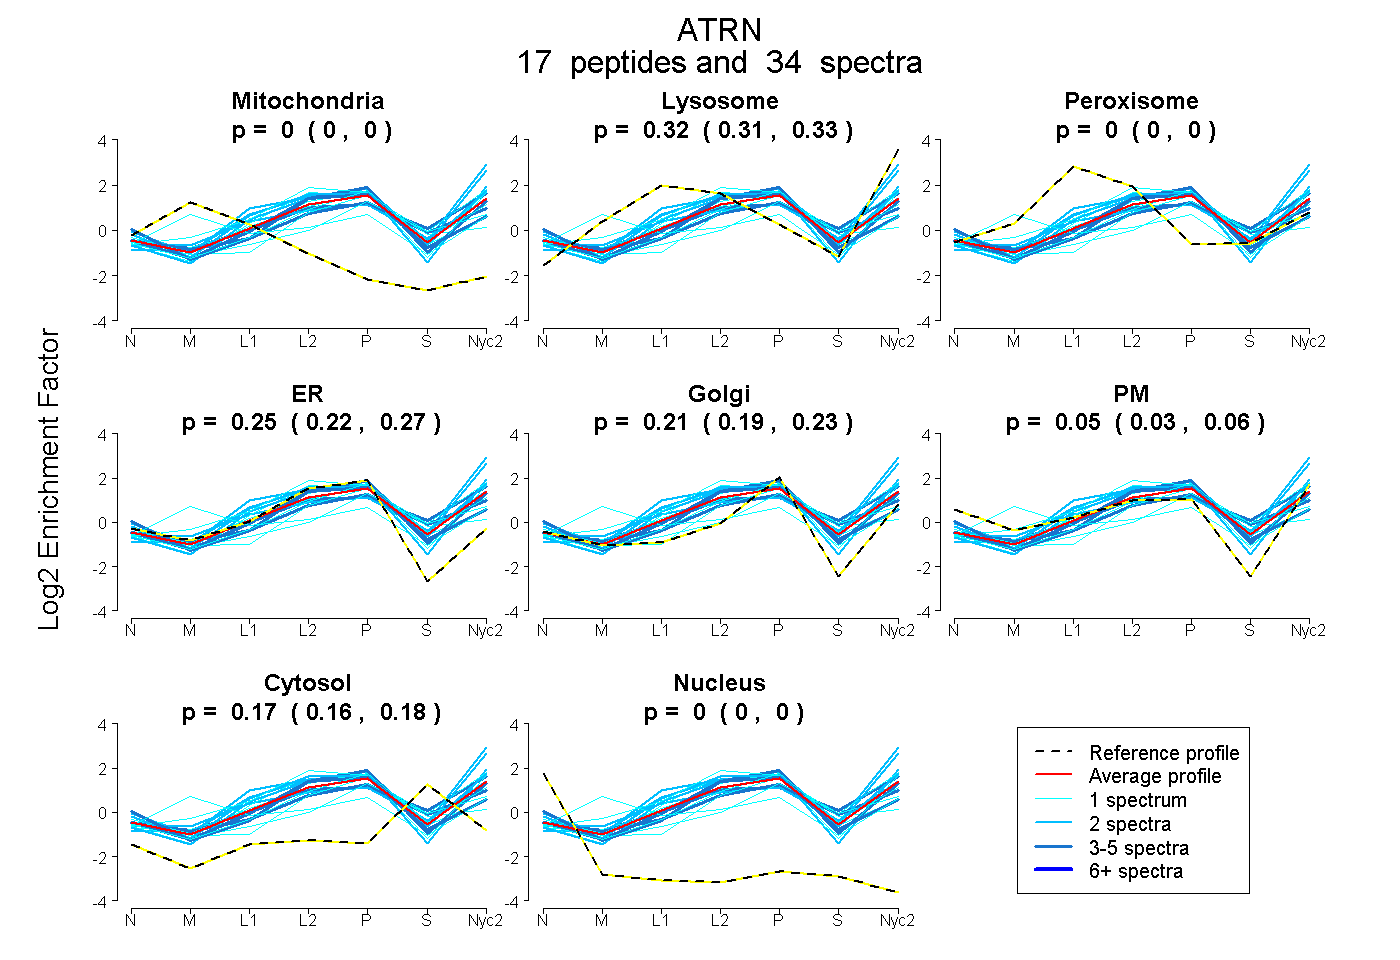
0.000 | 0.000
0.308 | 0.325
0.000 | 0.000
0.223 | 0.270
0.190 | 0.235
0.031 | 0.062
0.165 | 0.177
0.000 | 0.000
2peptides
spectra
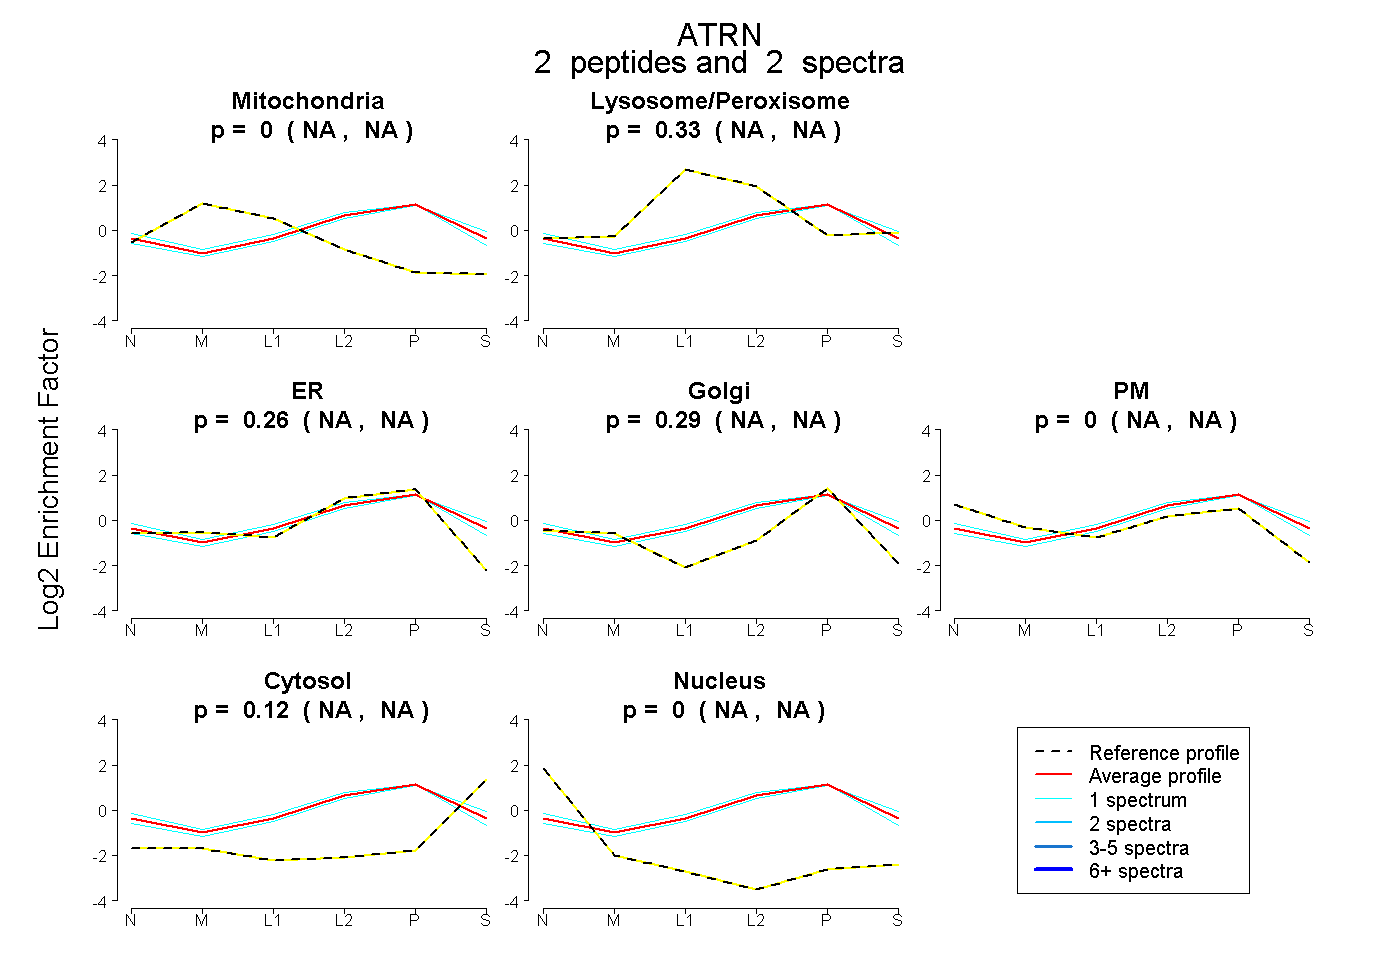
NA | NA
NA | NA
NA | NA
NA | NA
NA | NA
NA | NA
NA | NA
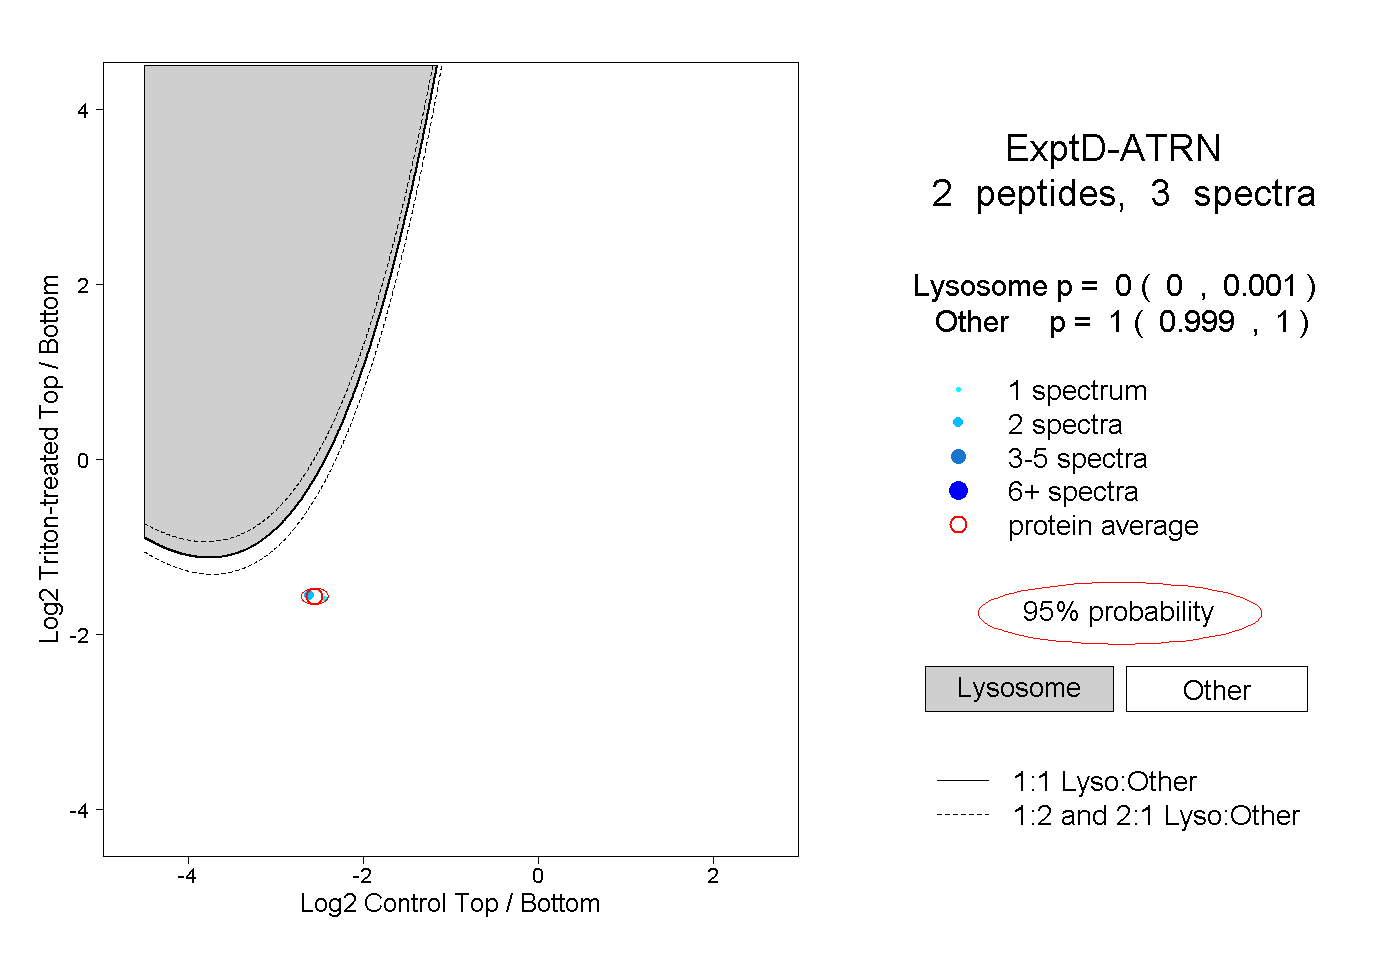
19peptides
spectra
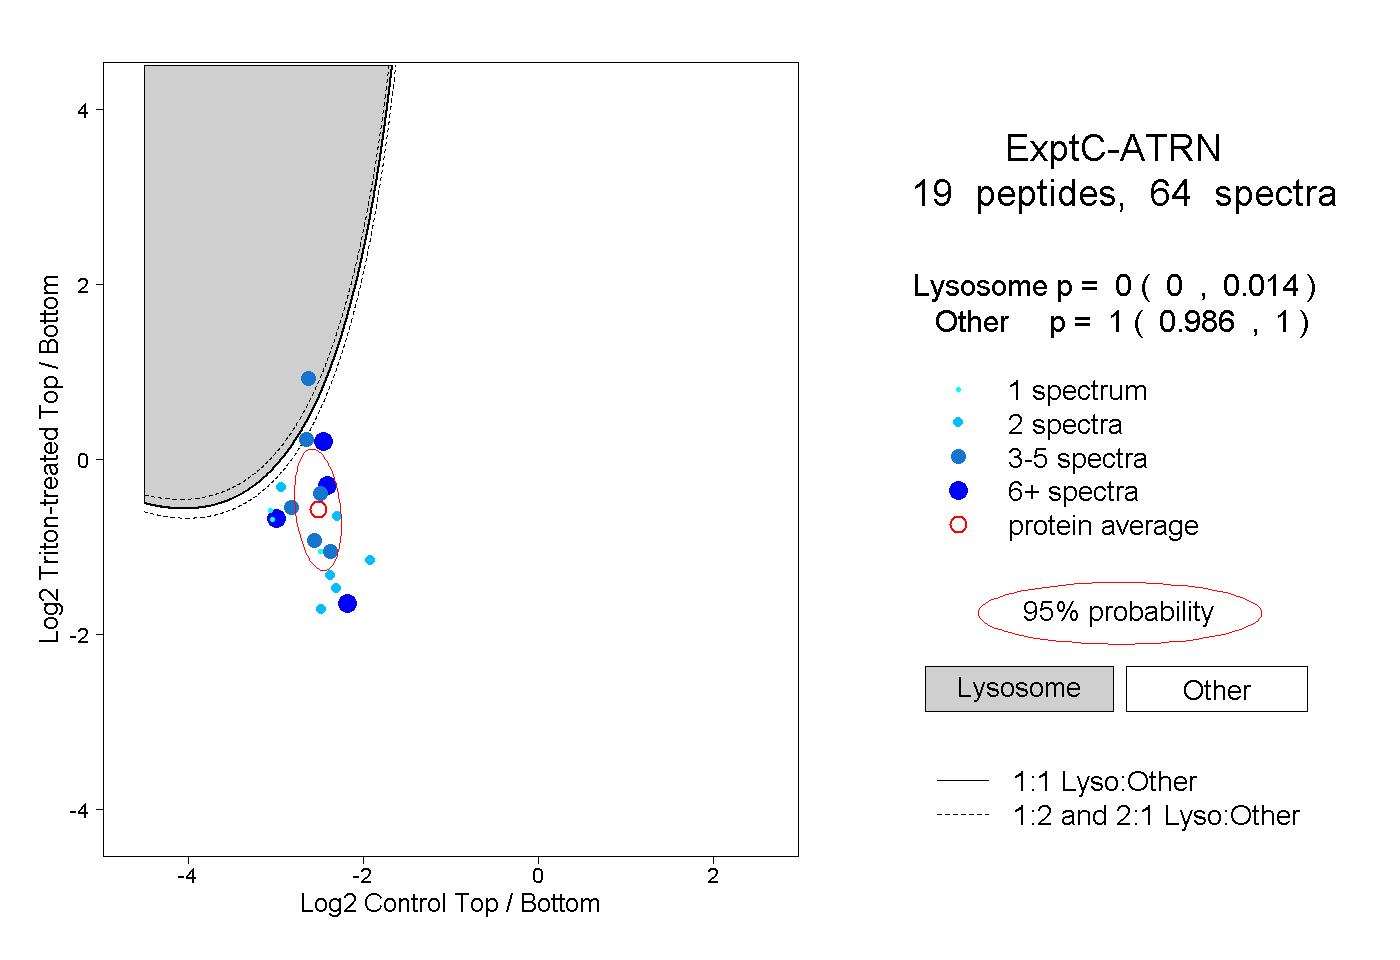
0.000 | 0.014
0.986 | 1.000