 17
17peptides
spectra
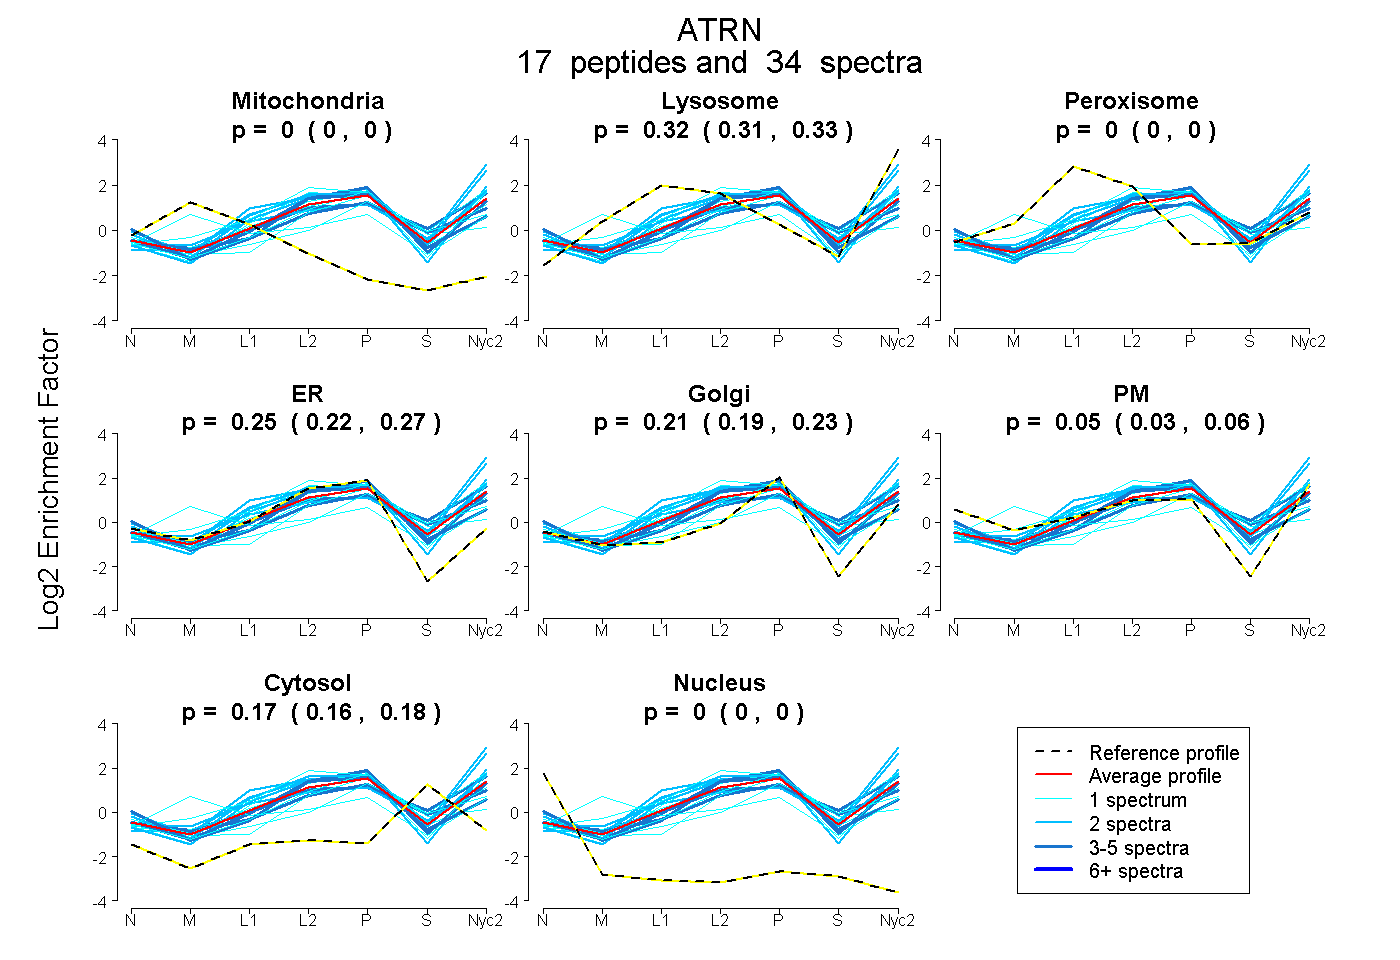
0.000 | 0.000
0.308 | 0.325
0.000 | 0.000
0.223 | 0.270
0.190 | 0.235
0.031 | 0.062
0.165 | 0.177
0.000 | 0.000
| Plot | Mito | Lyso | Perox | ER | Golgi | PM | Cytosol | Nucleus | |||||
| Expt A |
17 peptides |
34 spectra |
|
0.000 0.000 | 0.000 |
0.318 0.308 | 0.325 |
0.000 0.000 | 0.000 |
0.249 0.223 | 0.270 |
0.215 0.190 | 0.235 |
0.047 0.031 | 0.062 |
0.171 0.165 | 0.177 |
0.000 0.000 | 0.000 |
| 2 spectra, CLWDTQSSR | 0.000 | 0.335 | 0.105 | 0.102 | 0.273 | 0.000 | 0.185 | 0.000 | ||
| 1 spectrum, TPCALR | 0.000 | 0.232 | 0.000 | 0.218 | 0.354 | 0.000 | 0.196 | 0.000 | ||
| 2 spectra, SEAACVAAGPGIR | 0.000 | 0.359 | 0.000 | 0.317 | 0.000 | 0.206 | 0.118 | 0.000 | ||
| 2 spectra, LADDLYR | 0.000 | 0.517 | 0.000 | 0.000 | 0.426 | 0.000 | 0.057 | 0.000 | ||
| 1 spectrum, HCETCISGFYGDPTNGGK | 0.000 | 0.438 | 0.000 | 0.300 | 0.058 | 0.000 | 0.204 | 0.000 | ||
| 1 spectrum, GEECQLCEVENR | 0.000 | 0.059 | 0.000 | 0.390 | 0.225 | 0.000 | 0.325 | 0.000 | ||
| 2 spectra, DSFSNEK | 0.000 | 0.334 | 0.000 | 0.269 | 0.058 | 0.332 | 0.007 | 0.000 | ||
| 1 spectrum, NHNAFLASLTSQK | 0.000 | 0.062 | 0.041 | 0.000 | 0.416 | 0.148 | 0.332 | 0.000 | ||
| 3 spectra, ENYDNAK | 0.000 | 0.245 | 0.000 | 0.191 | 0.203 | 0.068 | 0.292 | 0.000 | ||
| 1 spectrum, YGHSLALHK | 0.224 | 0.243 | 0.055 | 0.000 | 0.400 | 0.000 | 0.078 | 0.000 | ||
| 1 spectrum, SECFSK | 0.000 | 0.448 | 0.000 | 0.475 | 0.066 | 0.000 | 0.011 | 0.000 | ||
| 4 spectra, TLDHDR | 0.000 | 0.055 | 0.000 | 0.479 | 0.000 | 0.260 | 0.207 | 0.000 | ||
| 5 spectra, LTLTPWVGLR | 0.000 | 0.261 | 0.000 | 0.357 | 0.280 | 0.000 | 0.101 | 0.000 | ||
| 1 spectrum, GICNASDTR | 0.000 | 0.321 | 0.000 | 0.124 | 0.294 | 0.135 | 0.127 | 0.000 | ||
| 1 spectrum, CTSWELATEEQAEK | 0.000 | 0.229 | 0.000 | 0.543 | 0.037 | 0.000 | 0.191 | 0.000 | ||
| 2 spectra, EEYSDLK | 0.000 | 0.621 | 0.000 | 0.000 | 0.337 | 0.000 | 0.042 | 0.000 | ||
| 4 spectra, AFSANK | 0.000 | 0.378 | 0.000 | 0.089 | 0.147 | 0.124 | 0.263 | 0.000 |
| Plot | Mito | Lyso or Perox | ER | Golgi | PM | Cytosol | Nucleus | ||||||
| Expt B |
2 peptides |
2 spectra |
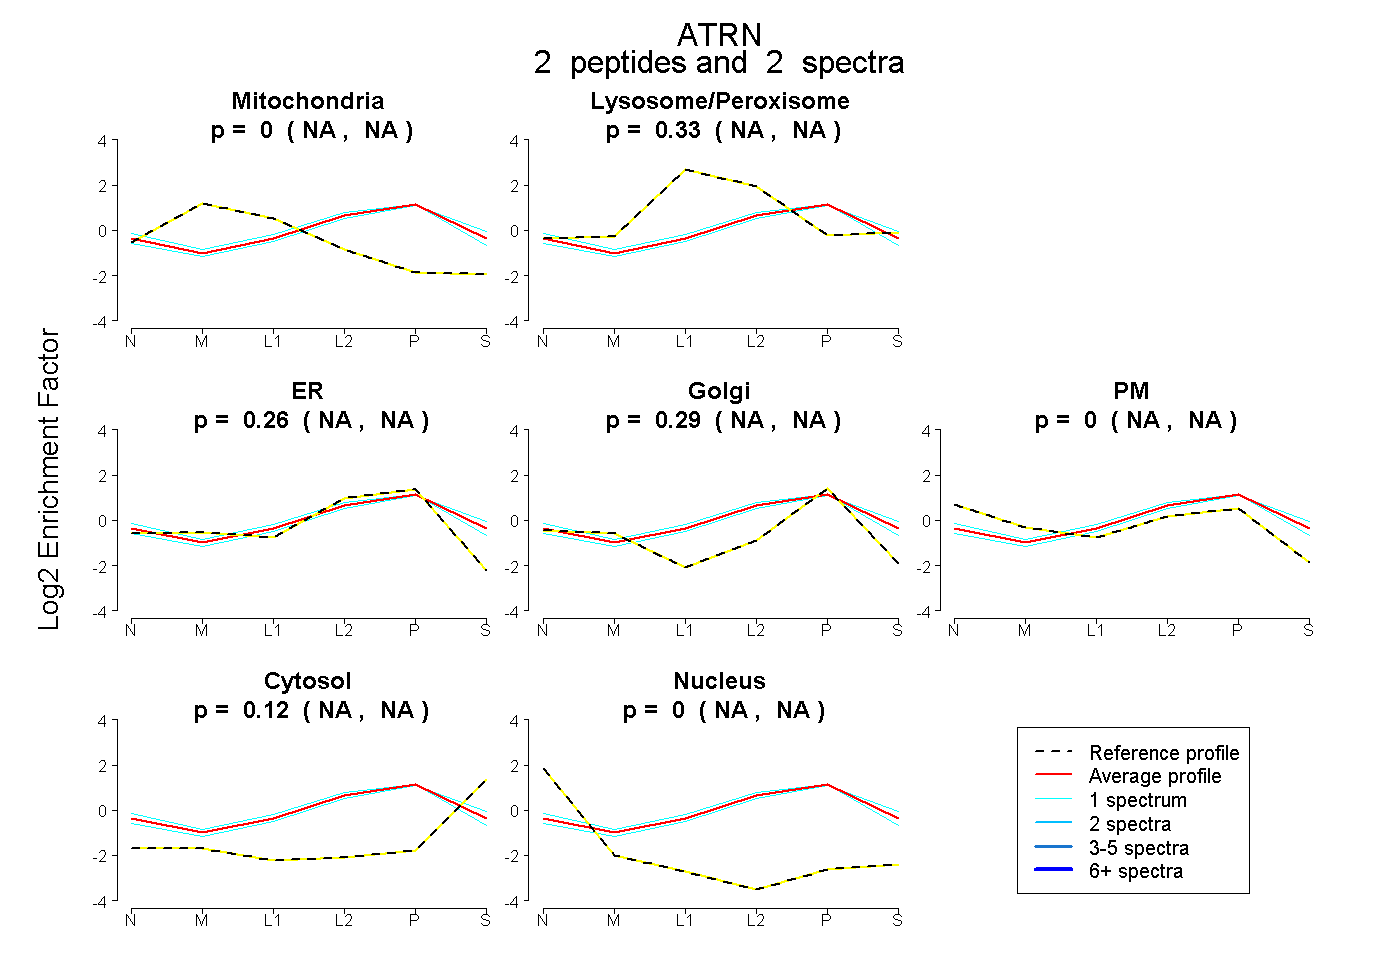 |
0.000 NA | NA |
0.327 NA | NA |
0.263 NA | NA |
0.293 NA | NA |
0.000 NA | NA |
0.117 NA | NA |
0.000 NA | NA |
|||
| Plot | Lyso | Other | |||||||||||
| Expt C |
19 peptides |
64 spectra |
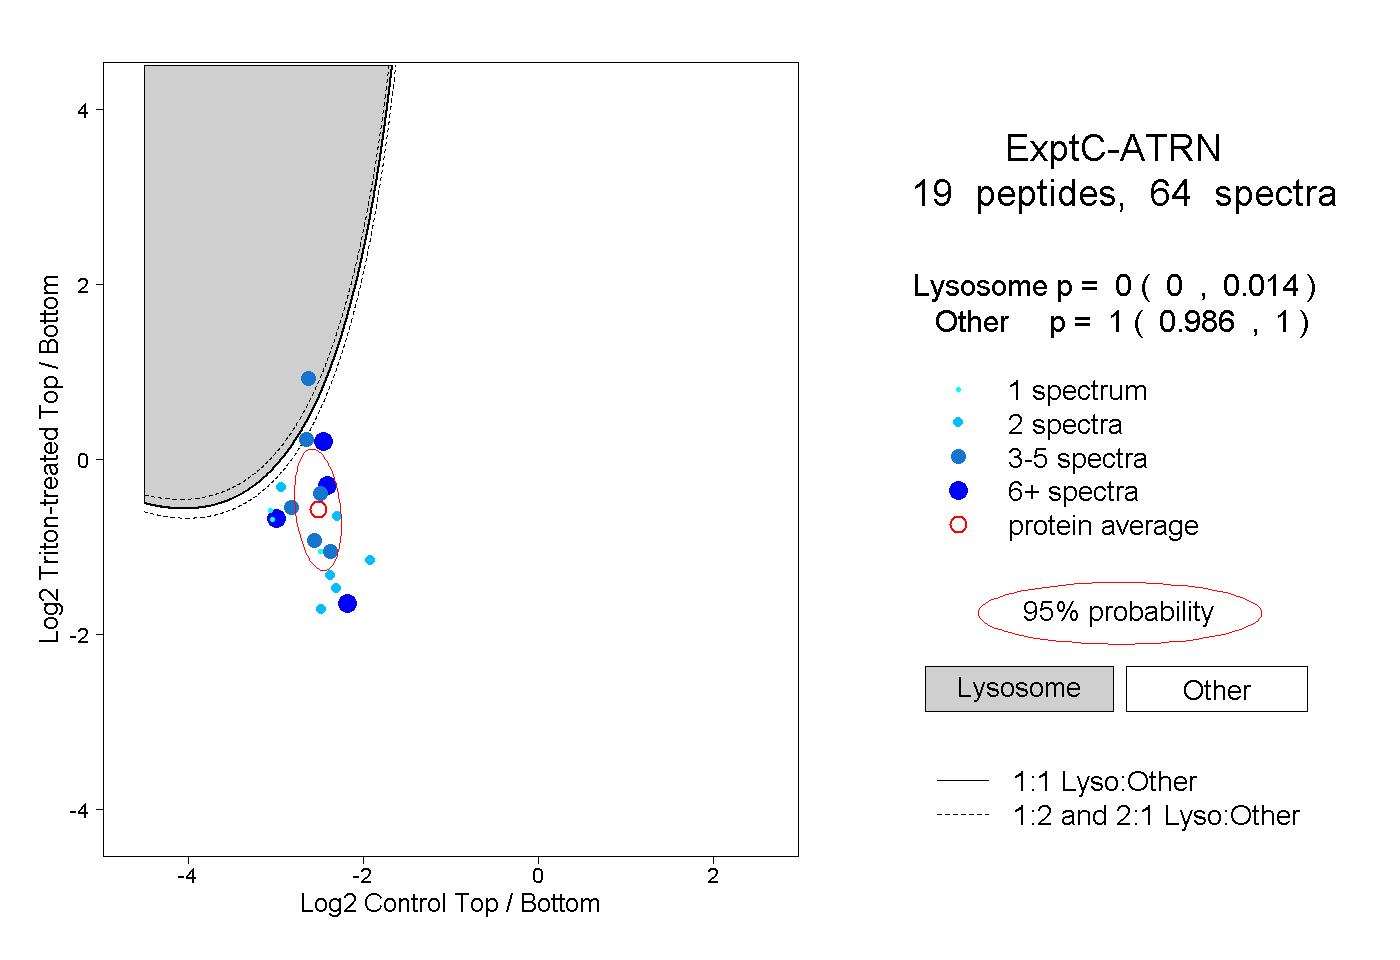 |
0.000 0.000 | 0.014 |
1.000 0.986 | 1.000 |
||||||||
| Plot | Lyso | Other | |||||||||||
| Expt D |
2 peptides |
3 spectra |
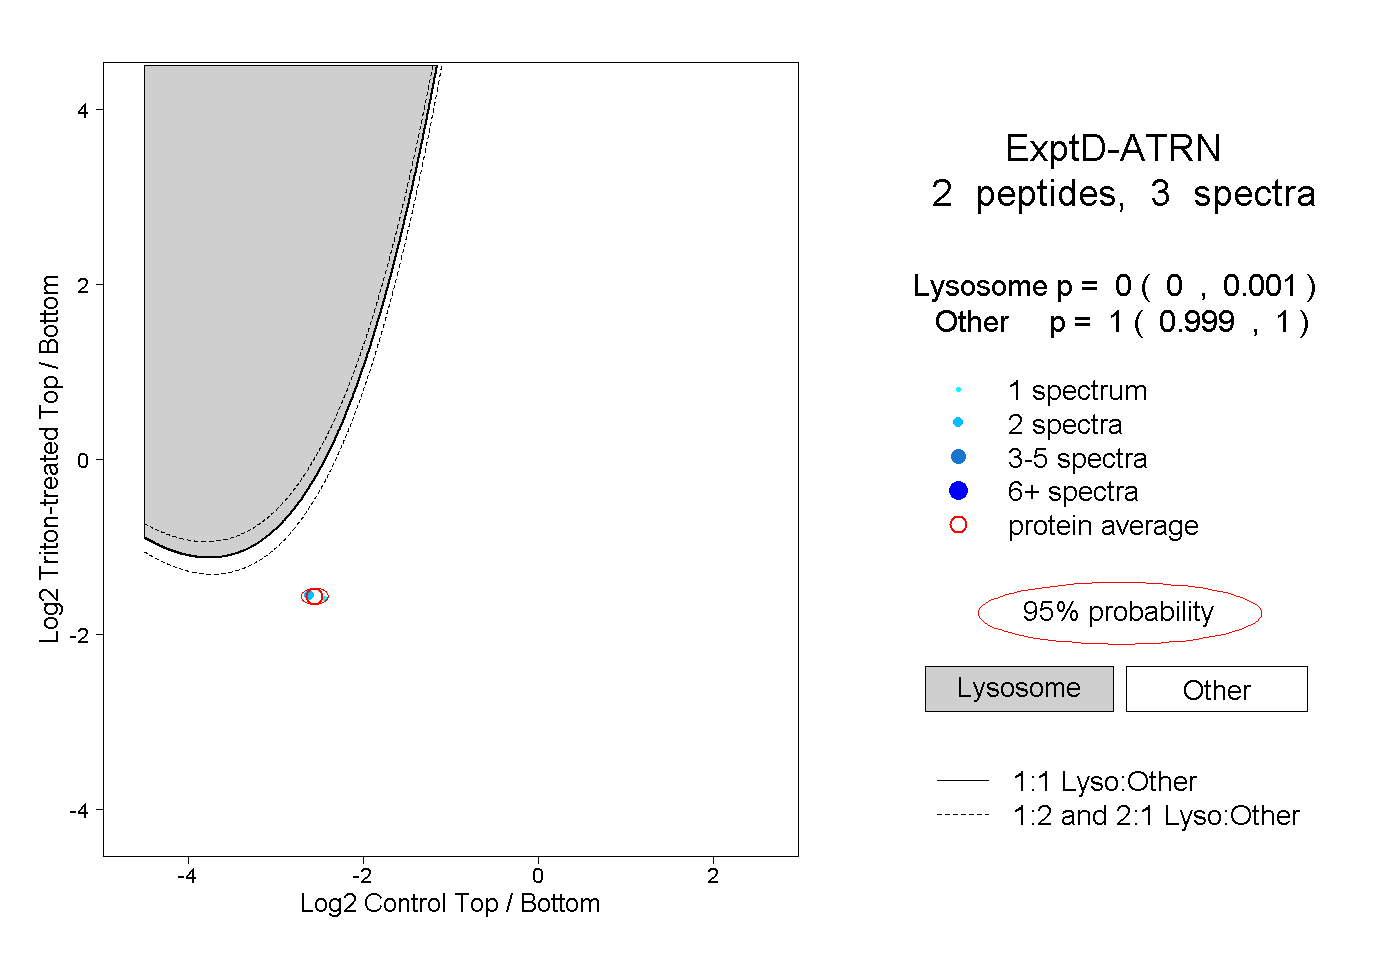 |
0.000 0.000 | 0.001 |
1.000 0.999 | 1.000 |