 5
5peptides
spectra
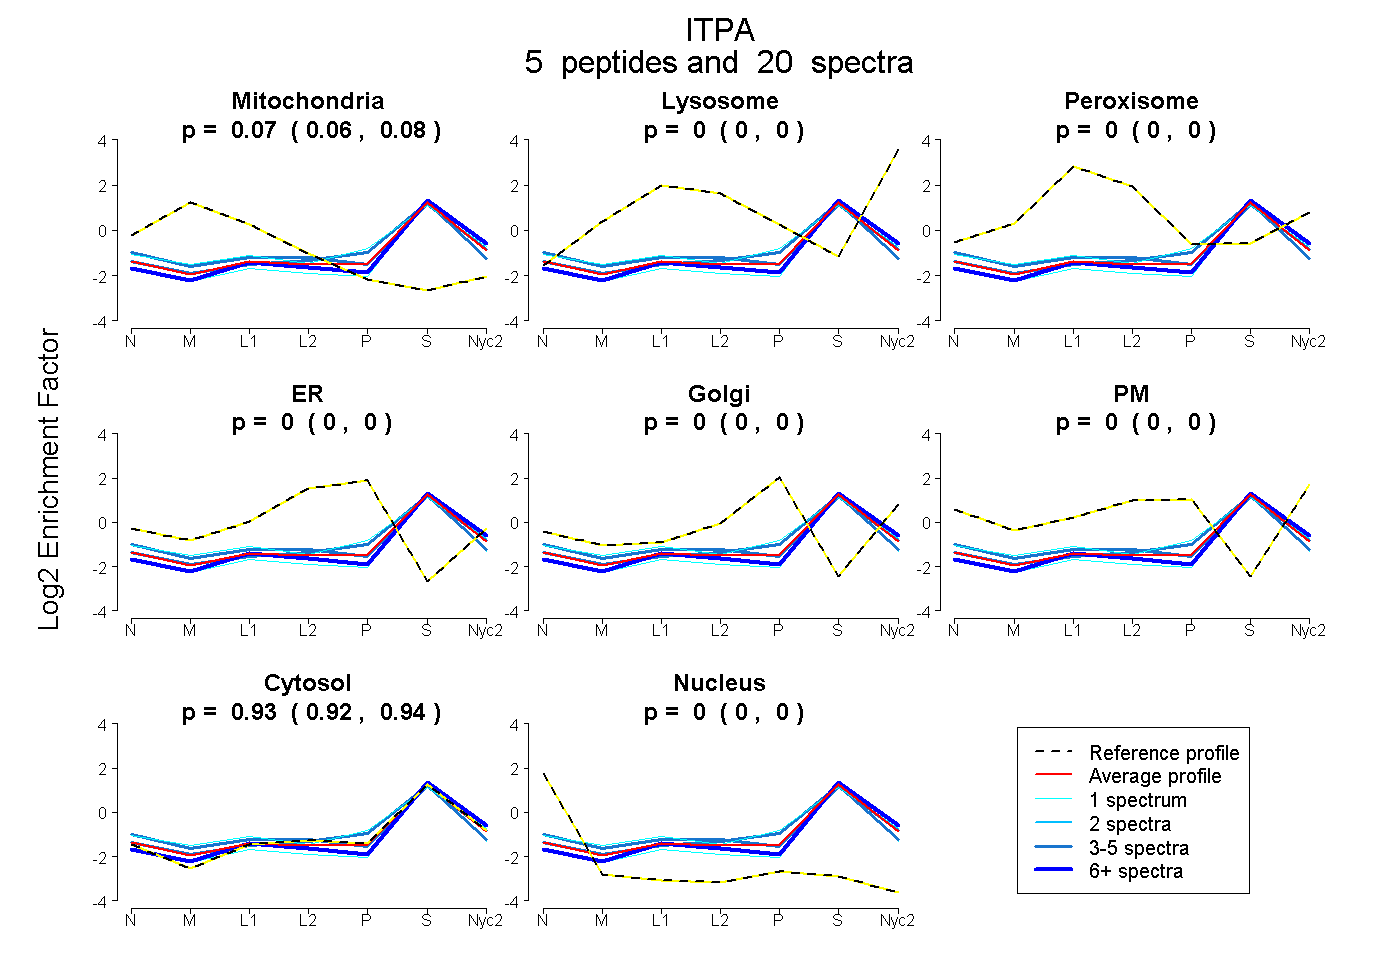
0.060 | 0.076
0.000 | 0.000
0.000 | 0.000
0.000 | 0.000
0.000 | 0.000
0.000 | 0.000
0.922 | 0.938
0.000 | 0.000
| Plot | Mito | Lyso | Perox | ER | Golgi | PM | Cytosol | Nucleus | |||||
| Expt A |
5 peptides |
20 spectra |
|
0.069 0.060 | 0.076 |
0.000 0.000 | 0.000 |
0.000 0.000 | 0.000 |
0.000 0.000 | 0.000 |
0.000 0.000 | 0.000 |
0.000 0.000 | 0.000 |
0.931 0.922 | 0.938 |
0.000 0.000 | 0.000 |
| 1 spectrum, LQEYFGVTDGAGDH | 0.081 | 0.018 | 0.015 | 0.000 | 0.067 | 0.000 | 0.820 | 0.000 | ||
| 3 spectra, IVFVTGNAK | 0.062 | 0.000 | 0.000 | 0.002 | 0.018 | 0.000 | 0.918 | 0.000 | ||
| 12 spectra, TPGQIVMPR | 0.021 | 0.000 | 0.000 | 0.000 | 0.000 | 0.000 | 0.979 | 0.000 | ||
| 1 spectrum, IDLPEYQGEPDEISIQK | 0.000 | 0.000 | 0.000 | 0.000 | 0.000 | 0.000 | 0.940 | 0.060 | ||
| 3 spectra, CQEAAR | 0.113 | 0.000 | 0.034 | 0.000 | 0.000 | 0.000 | 0.853 | 0.000 |
| Plot | Mito | Lyso or Perox | ER | Golgi | PM | Cytosol | Nucleus | ||||||
| Expt B |
1 peptide |
1 spectrum |
 |
0.042 NA | NA |
0.327 NA | NA |
0.000 NA | NA |
0.000 NA | NA |
0.040 NA | NA |
0.588 NA | NA |
0.004 NA | NA |
|||
| Plot | Lyso | Other | |||||||||||
| Expt C |
4 peptides |
18 spectra |
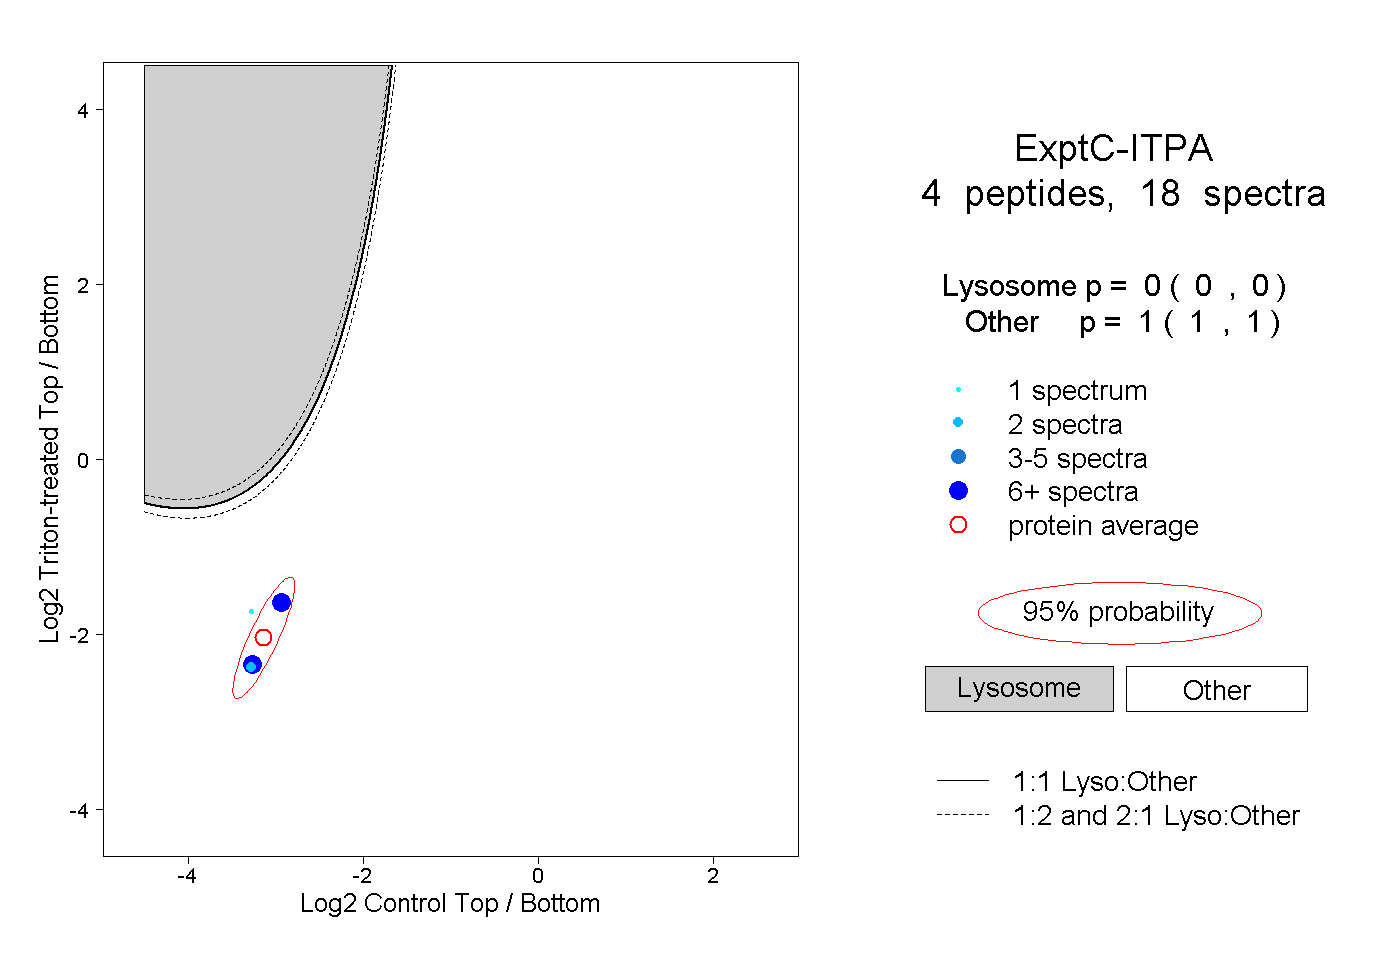 |
0.000 0.000 | 0.000 |
1.000 1.000 | 1.000 |