 2
2peptides
spectra
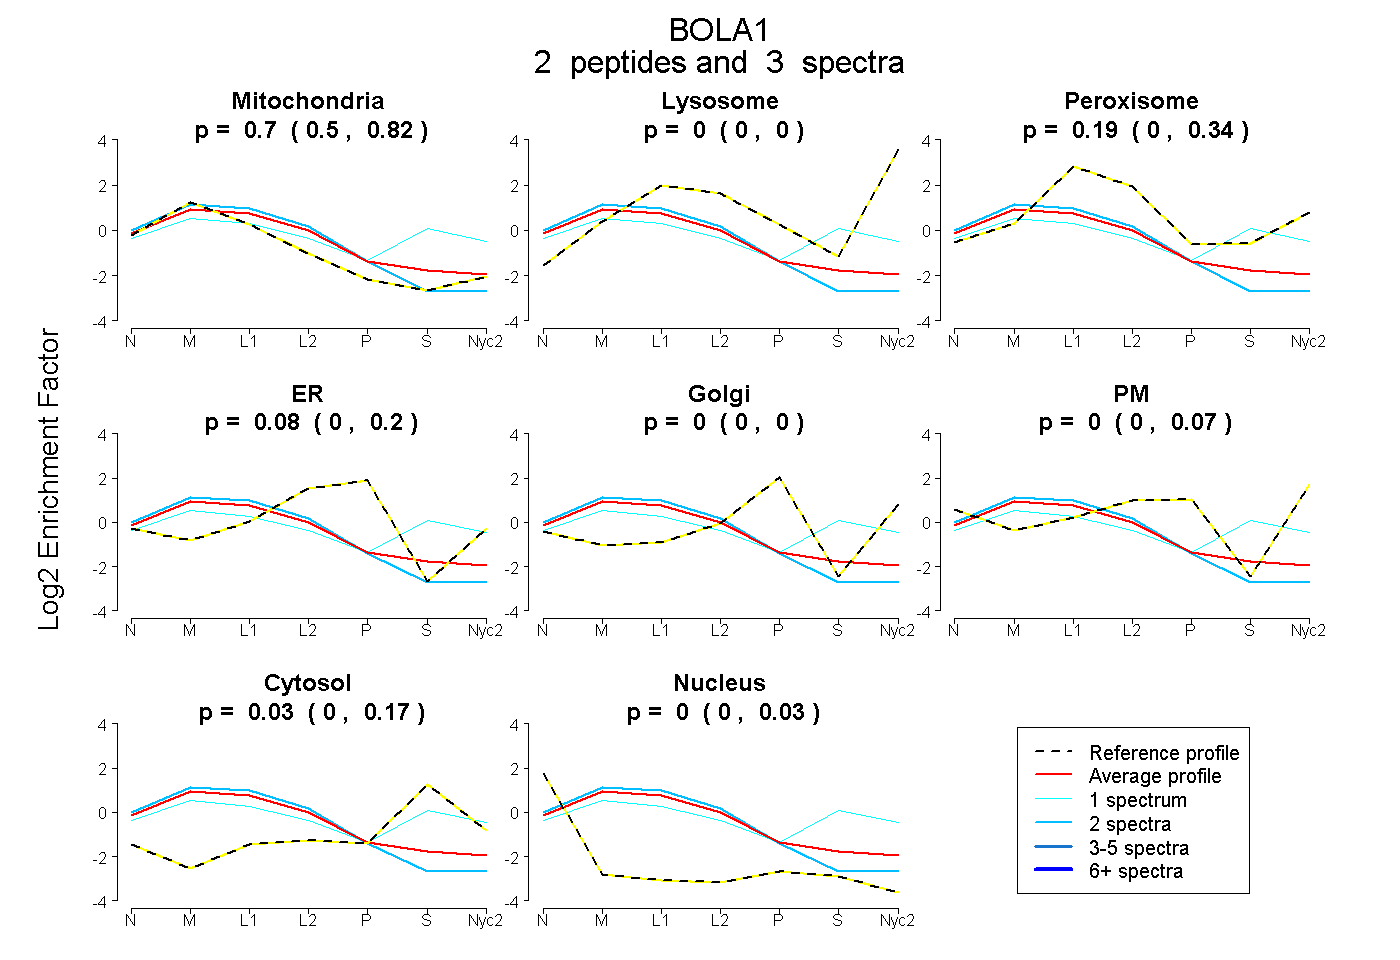
0.499 | 0.825
0.000 | 0.000
0.000 | 0.337
0.000 | 0.199
0.000 | 0.000
0.000 | 0.074
0.000 | 0.165
0.000 | 0.030
1peptide
spectra
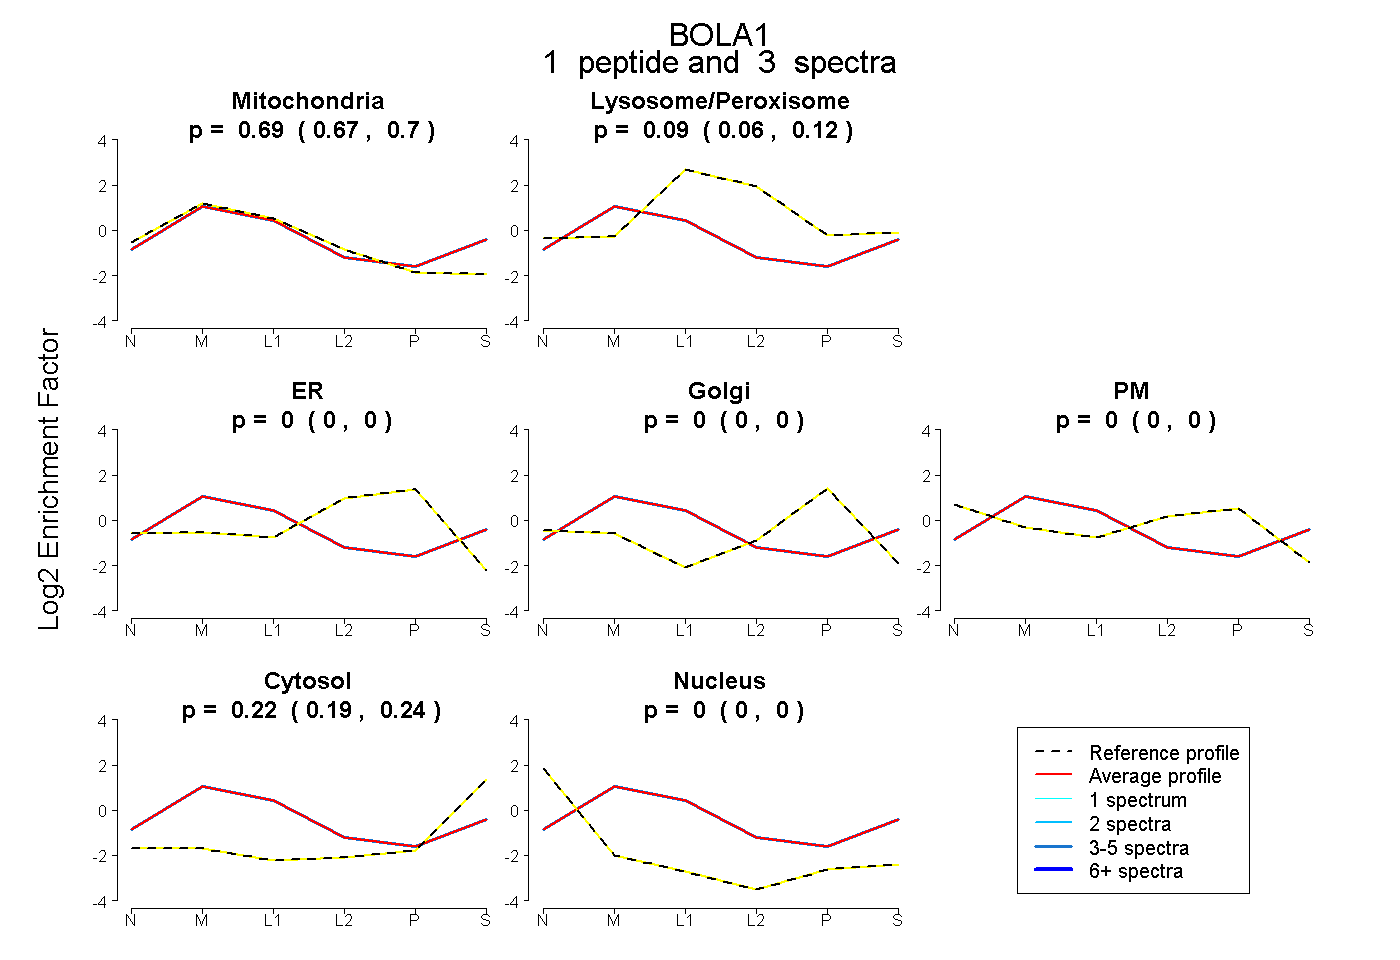
0.674 | 0.699
0.060 | 0.121
0.000 | 0.000
0.000 | 0.000
0.000 | 0.000
0.191 | 0.245
0.000 | 0.000
5peptides
spectra
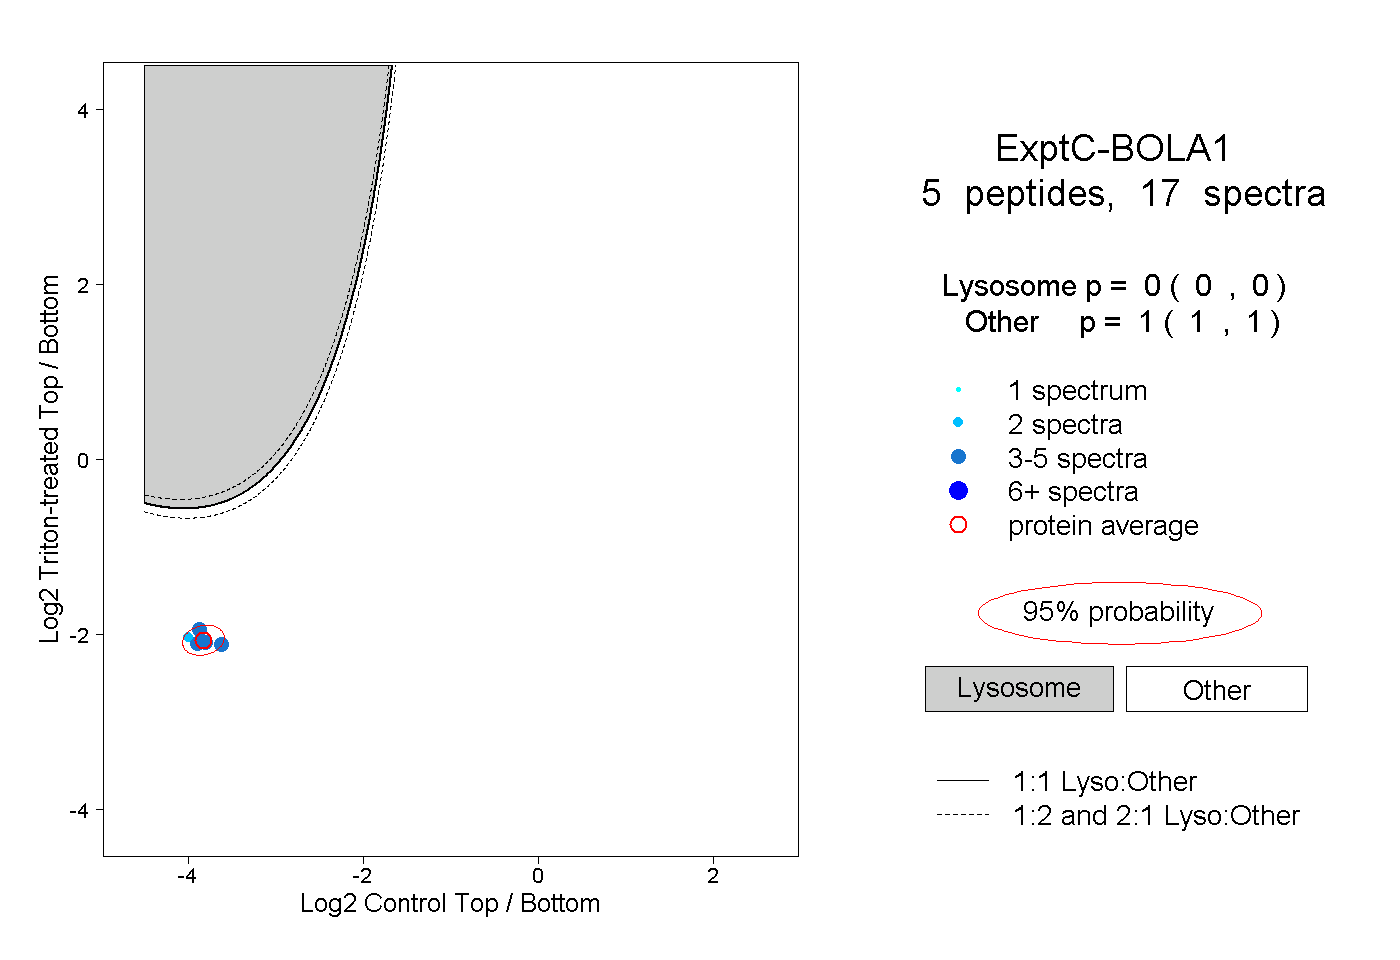
0.000 | 0.000
1.000 | 1.000
2peptides
spectra
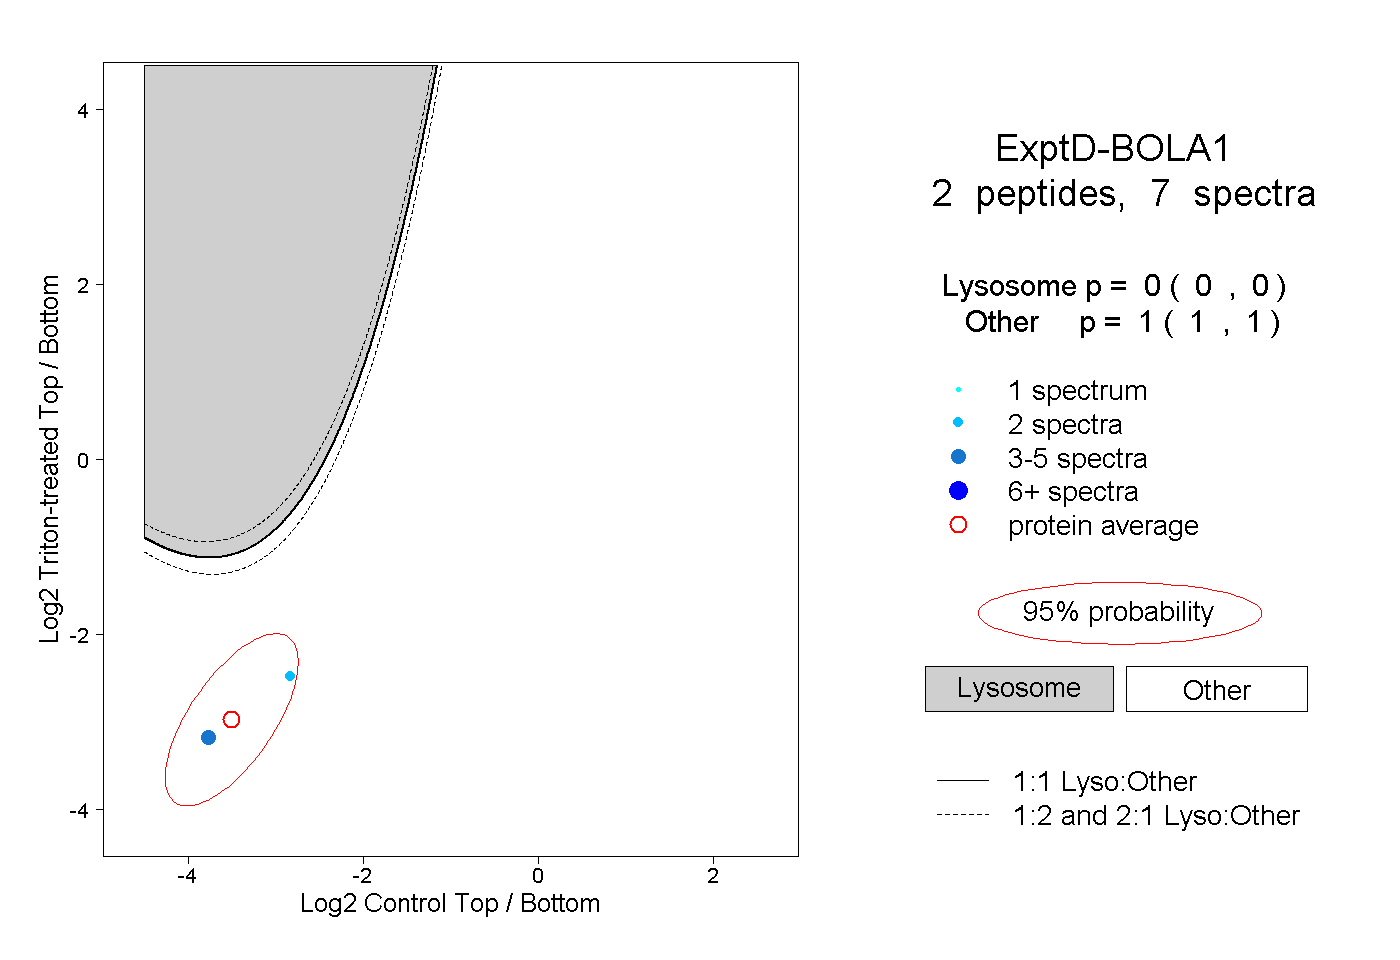
0.000 | 0.000
1.000 | 1.000