32
32peptides
spectra
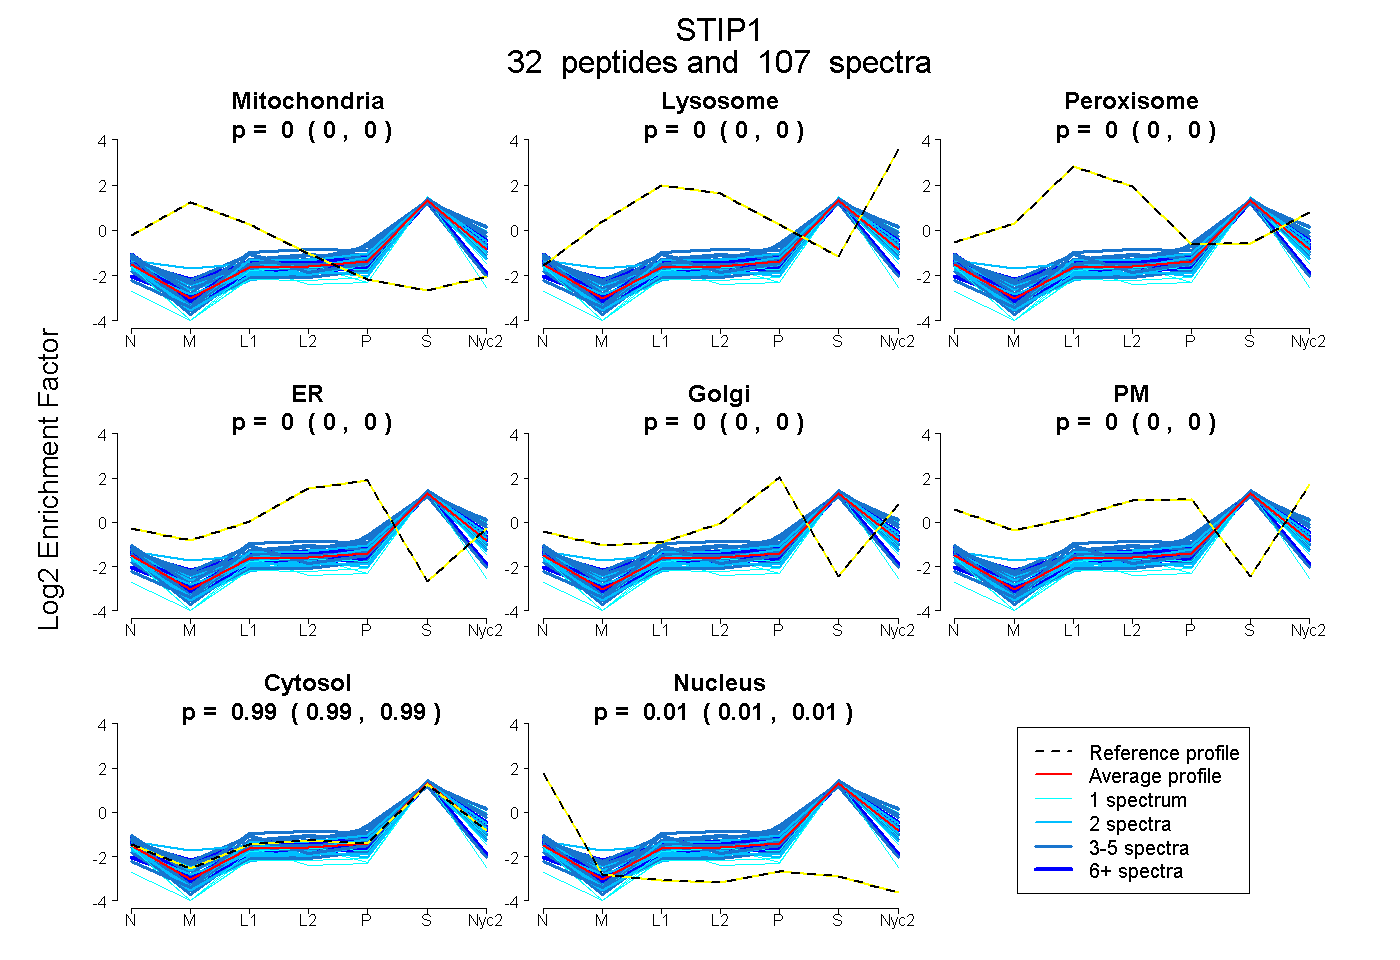
0.000 | 0.000
0.000 | 0.000
0.000 | 0.000
0.000 | 0.000
0.000 | 0.000
0.000 | 0.000
0.986 | 0.989
0.011 | 0.014
8peptides
spectra
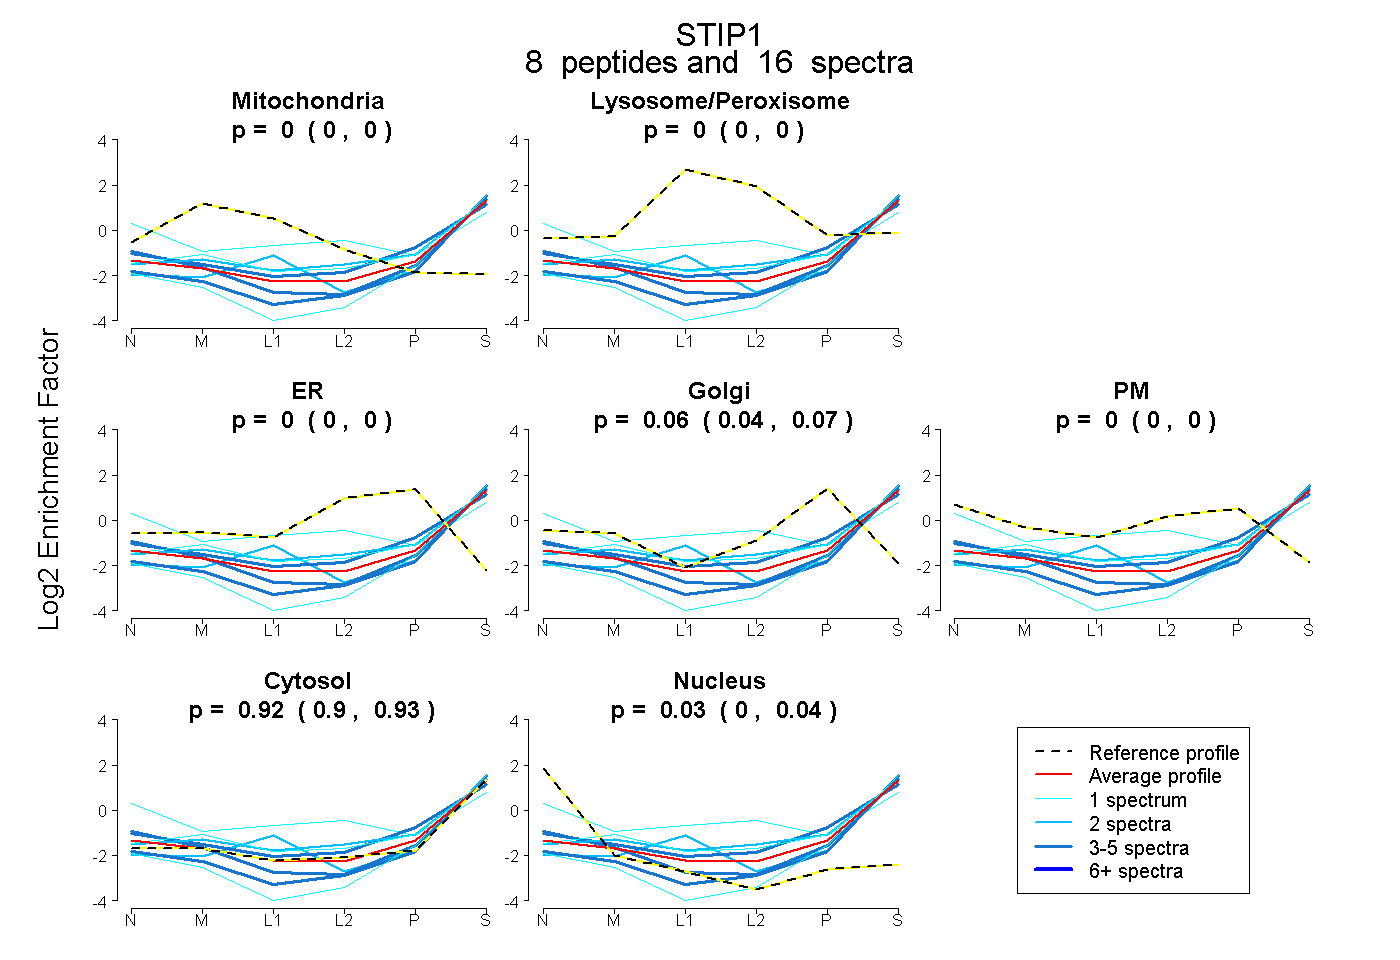
0.000 | 0.000
0.000 | 0.001
0.000 | 0.000
0.036 | 0.071
0.000 | 0.000
0.902 | 0.930
0.005 | 0.042