 3
3peptides
spectra
0.177 | 0.203
0.000 | 0.000
0.501 | 0.553
0.062 | 0.161
0.001 | 0.101
0.000 | 0.000
0.089 | 0.120
0.000 | 0.000
3peptides
spectra
0.000 | 0.000
1.000 | 1.000
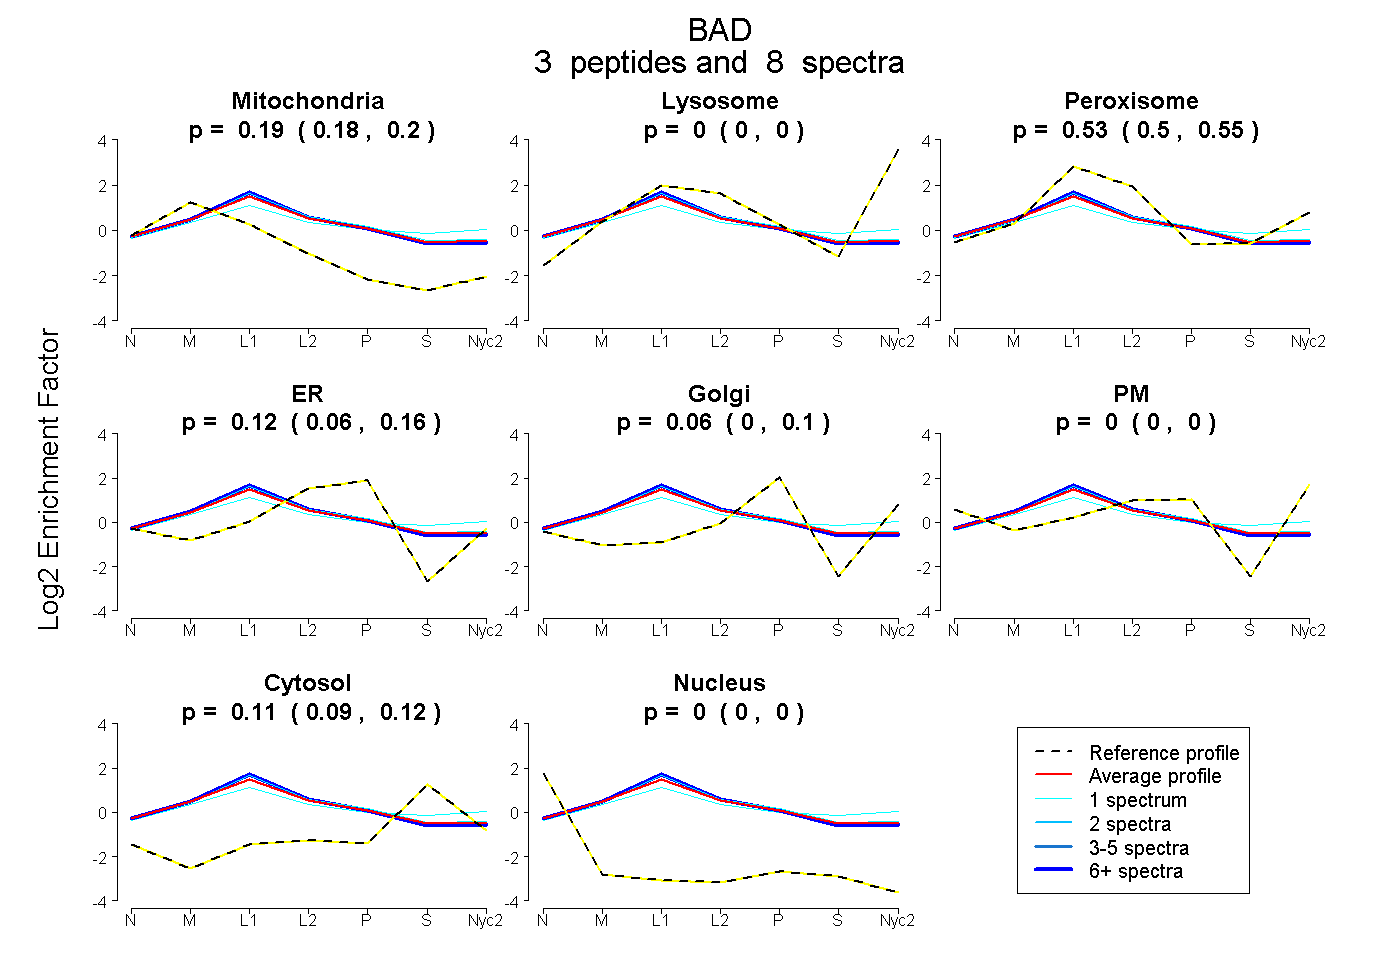
| Plot | Mito | Lyso | Perox | ER | Golgi | PM | Cytosol | Nucleus | |||||
| Expt A |
3 peptides |
8 spectra |
|
0.191 0.177 | 0.203 |
0.000 0.000 | 0.000 |
0.531 0.501 | 0.553 |
0.116 0.062 | 0.161 |
0.056 0.001 | 0.101 |
0.000 0.000 | 0.000 |
0.107 0.089 | 0.120 |
0.000 0.000 | 0.000 |
||
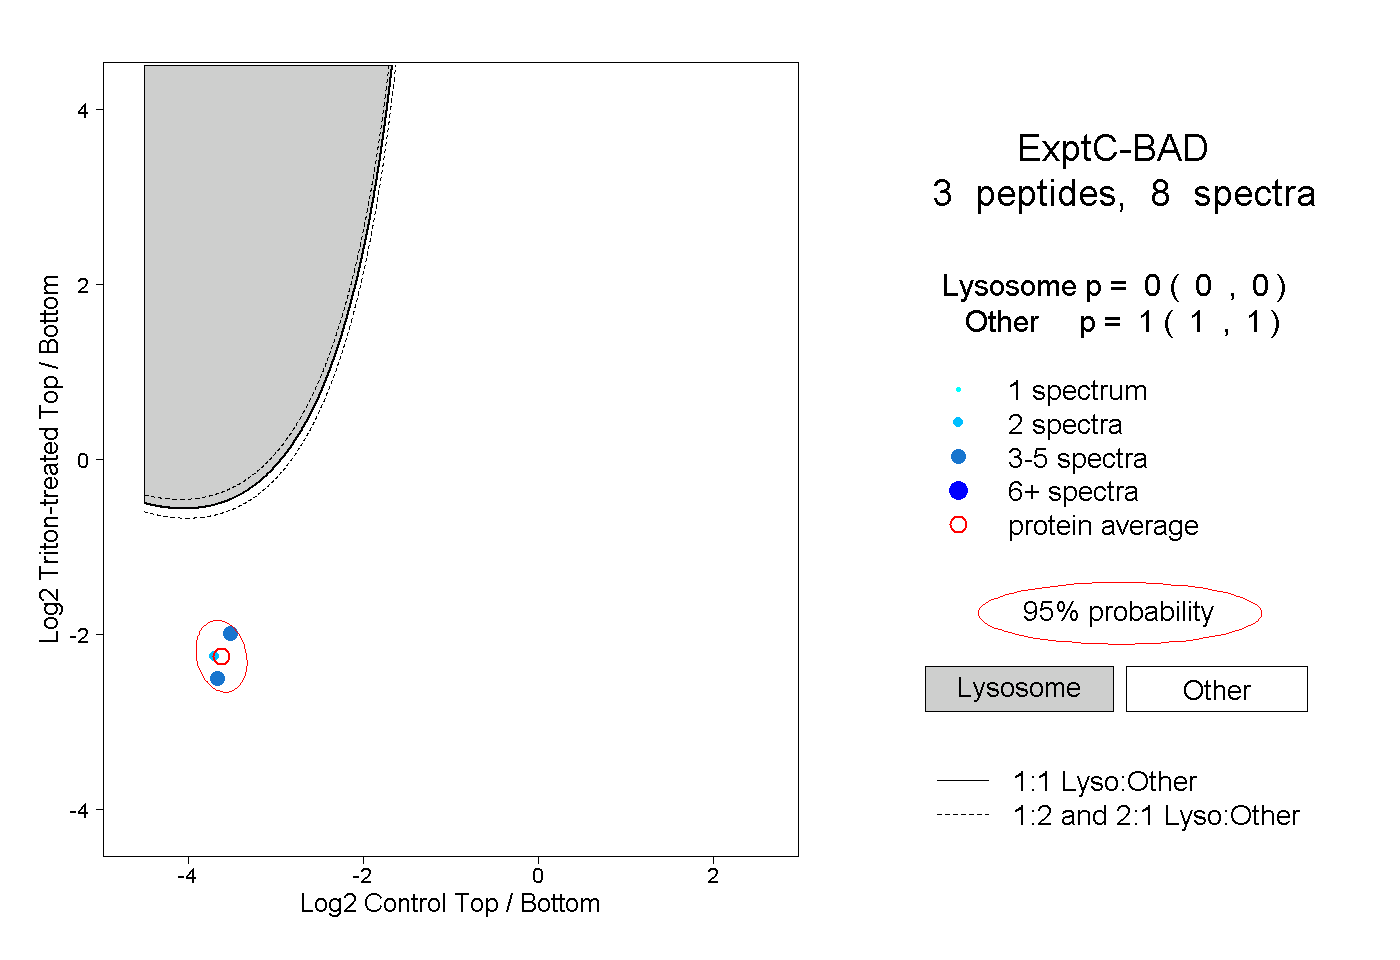
| Plot | Lyso | Other | |||||||||||
| Expt C |
3 peptides |
8 spectra |
|
0.000 0.000 | 0.000 |
1.000 1.000 | 1.000 |