 5
5peptides
spectra
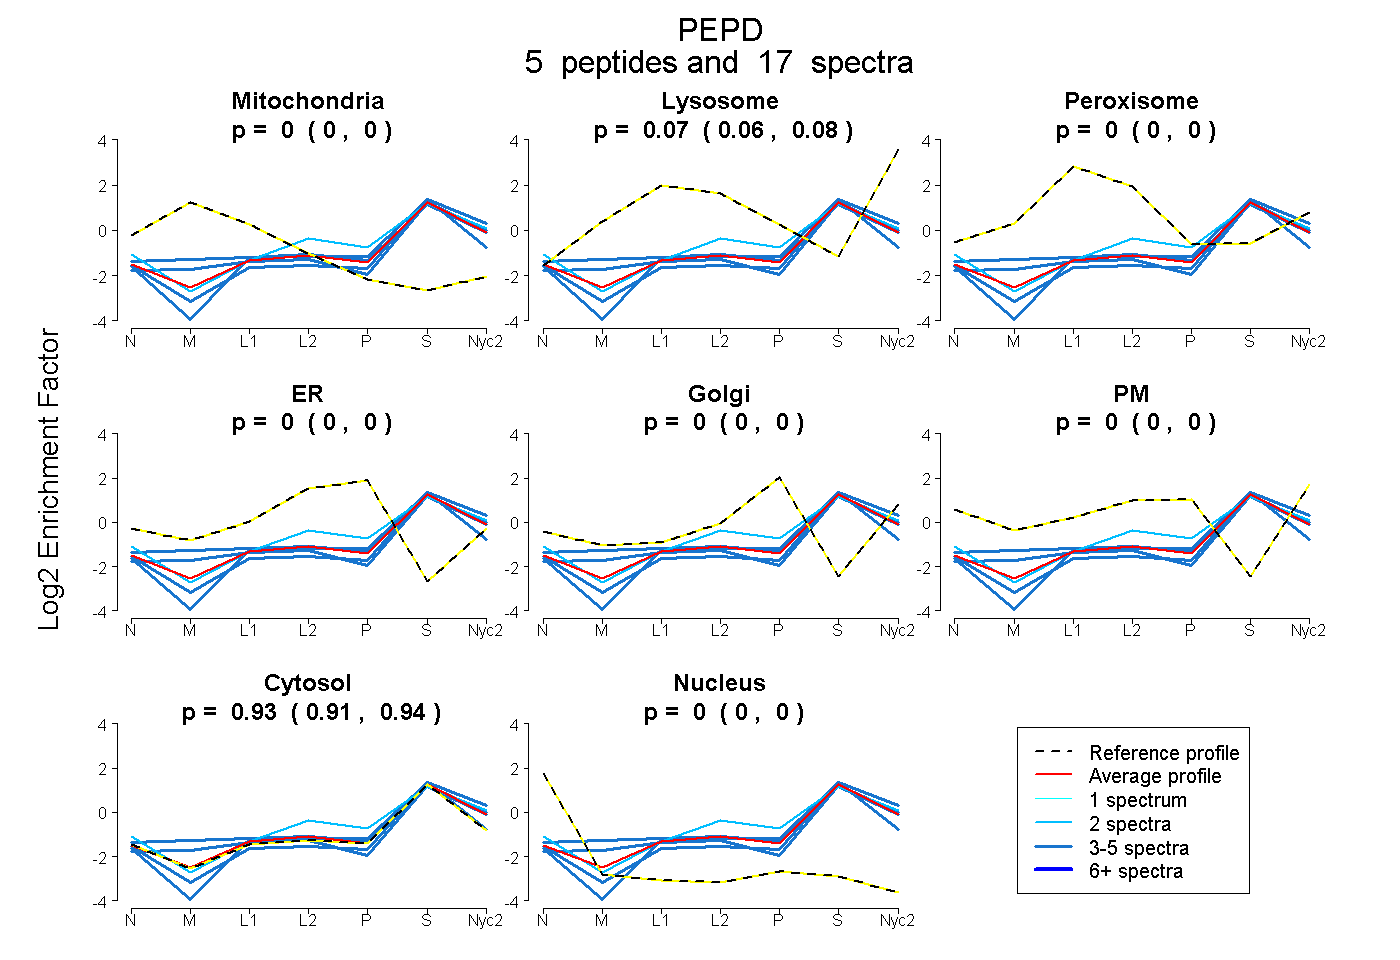
0.000 | 0.000
0.057 | 0.085
0.000 | 0.000
0.000 | 0.000
0.000 | 0.000
0.000 | 0.000
0.913 | 0.940
0.000 | 0.000
3peptides
spectra
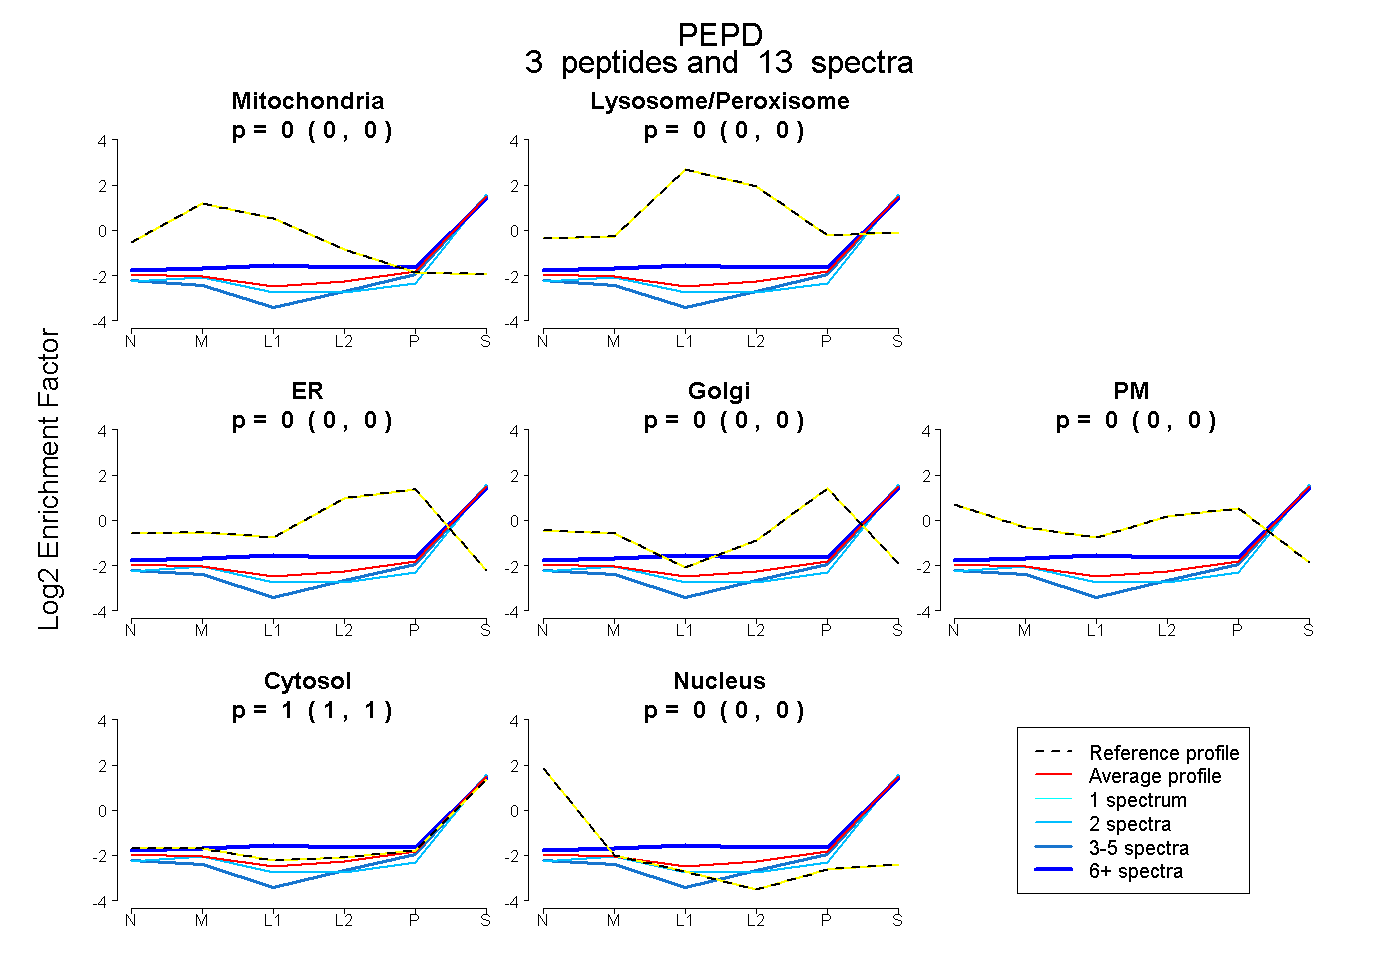
0.000 | 0.000
0.000 | 0.000
0.000 | 0.000
0.000 | 0.000
0.000 | 0.000
1.000 | 1.000
0.000 | 0.000
5peptides
spectra
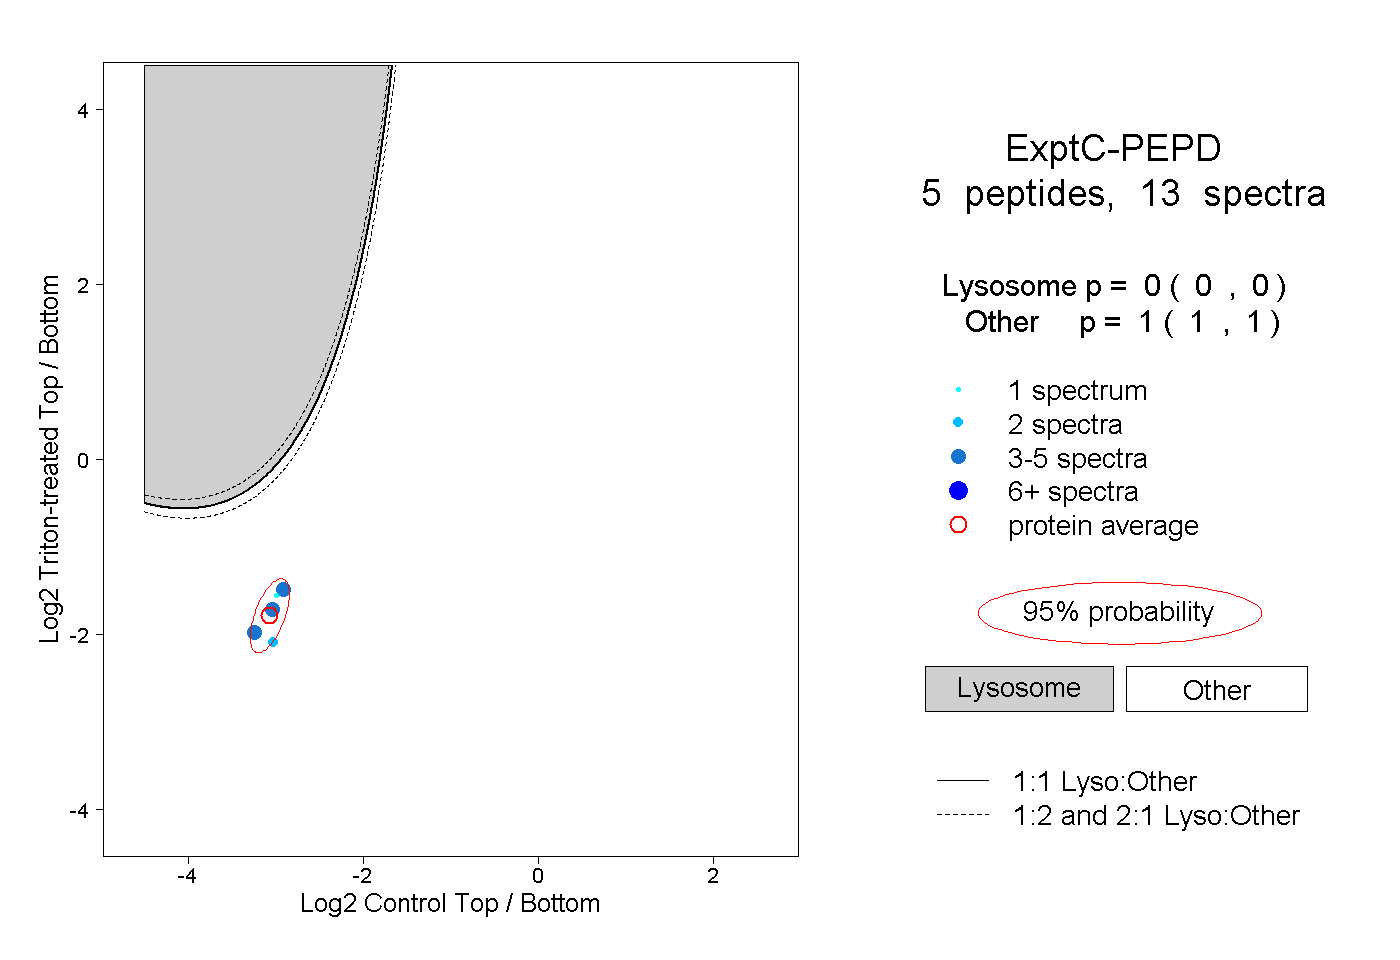
0.000 | 0.000
1.000 | 1.000
1peptide
spectrum
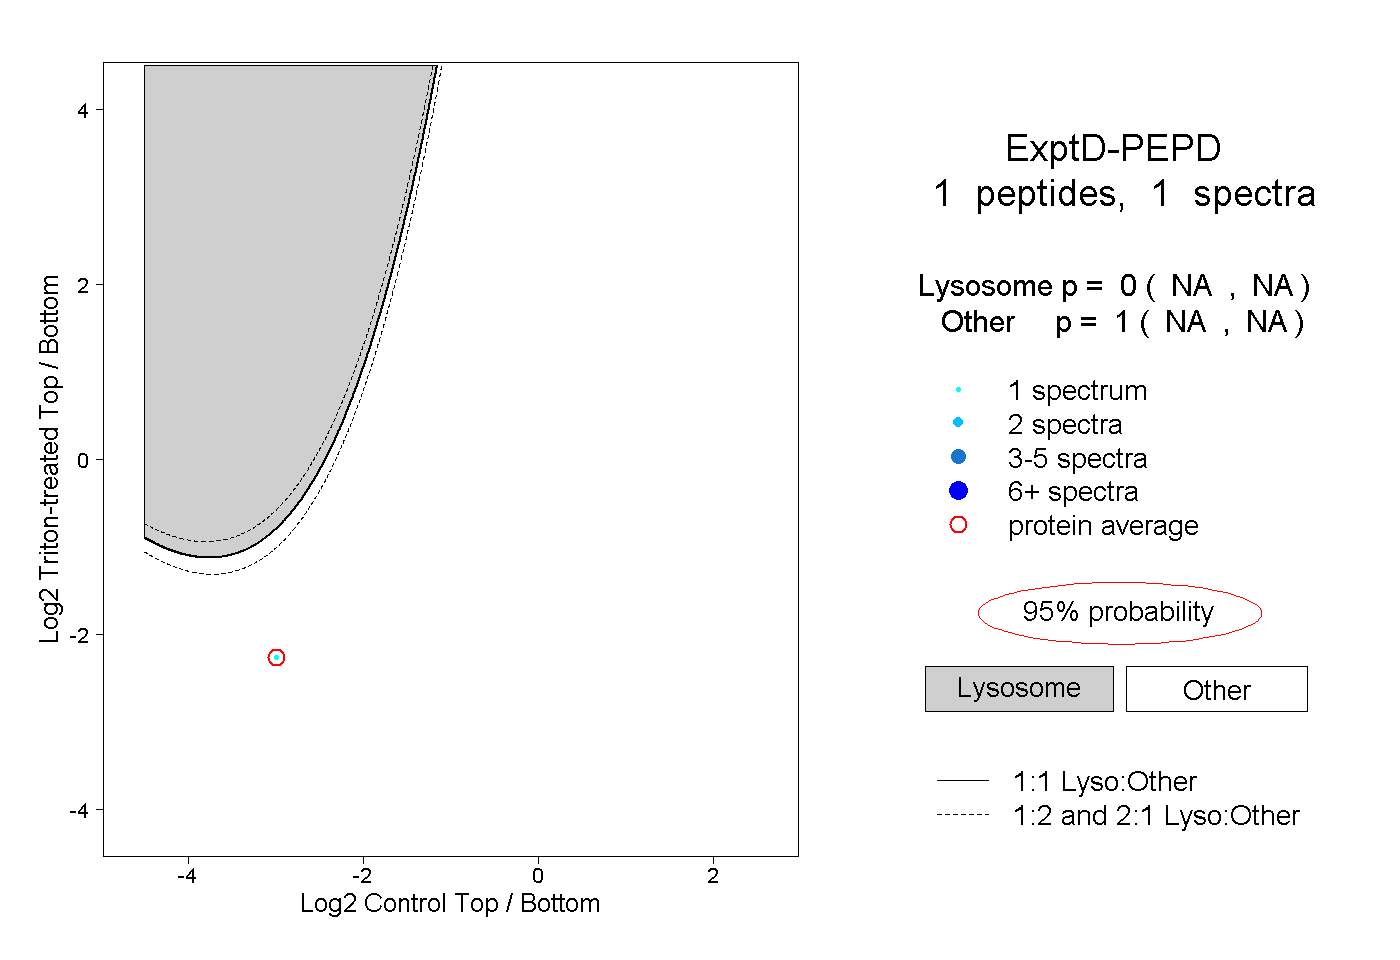
NA | NA
NA | NA