8
8peptides
spectra
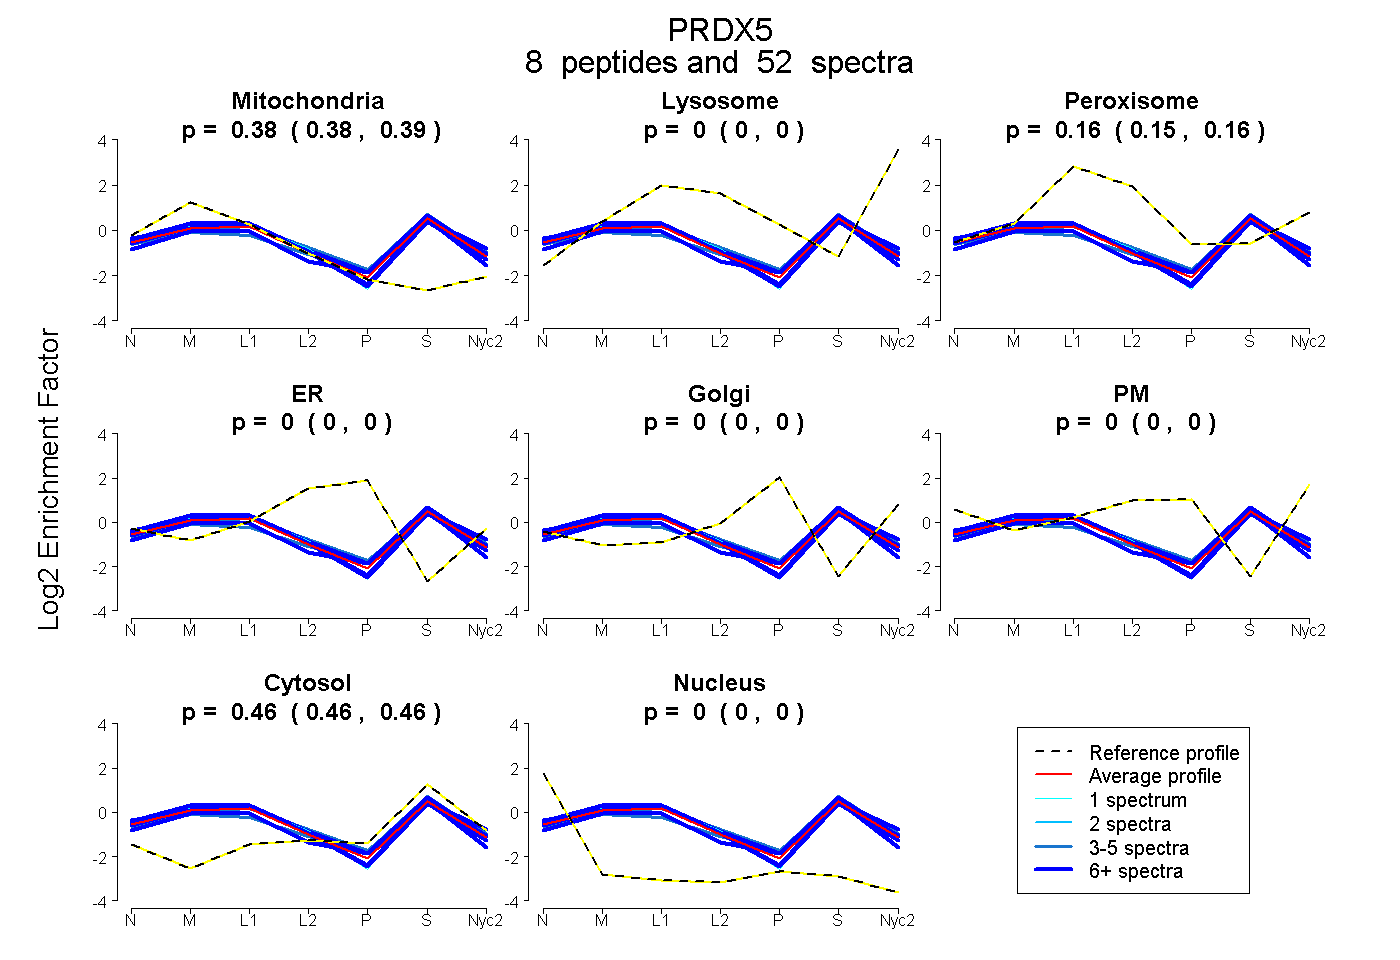
0.378 | 0.387
0.000 | 0.000
0.153 | 0.162
0.000 | 0.000
0.000 | 0.000
0.000 | 0.000
0.456 | 0.462
0.000 | 0.000
6peptides
spectra
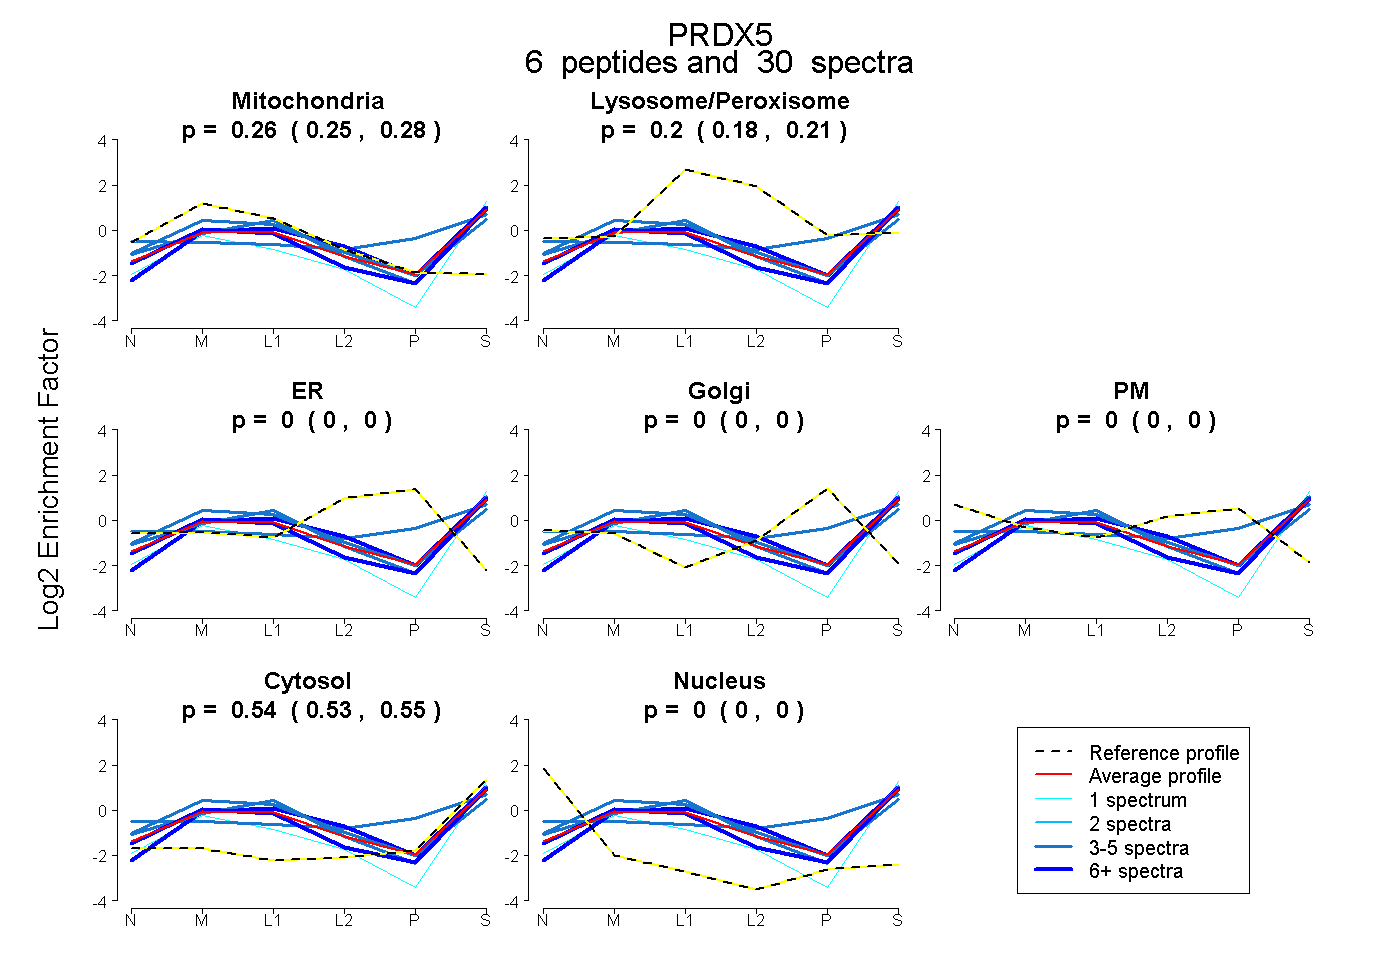
0.249 | 0.277
0.181 | 0.210
0.000 | 0.000
0.000 | 0.000
0.000 | 0.000
0.529 | 0.547
0.000 | 0.000