 8
8peptides
spectra
0.378 | 0.387
0.000 | 0.000
0.153 | 0.162
0.000 | 0.000
0.000 | 0.000
0.000 | 0.000
0.456 | 0.462
0.000 | 0.000
| Plot | Mito | Lyso | Perox | ER | Golgi | PM | Cytosol | Nucleus | |||||
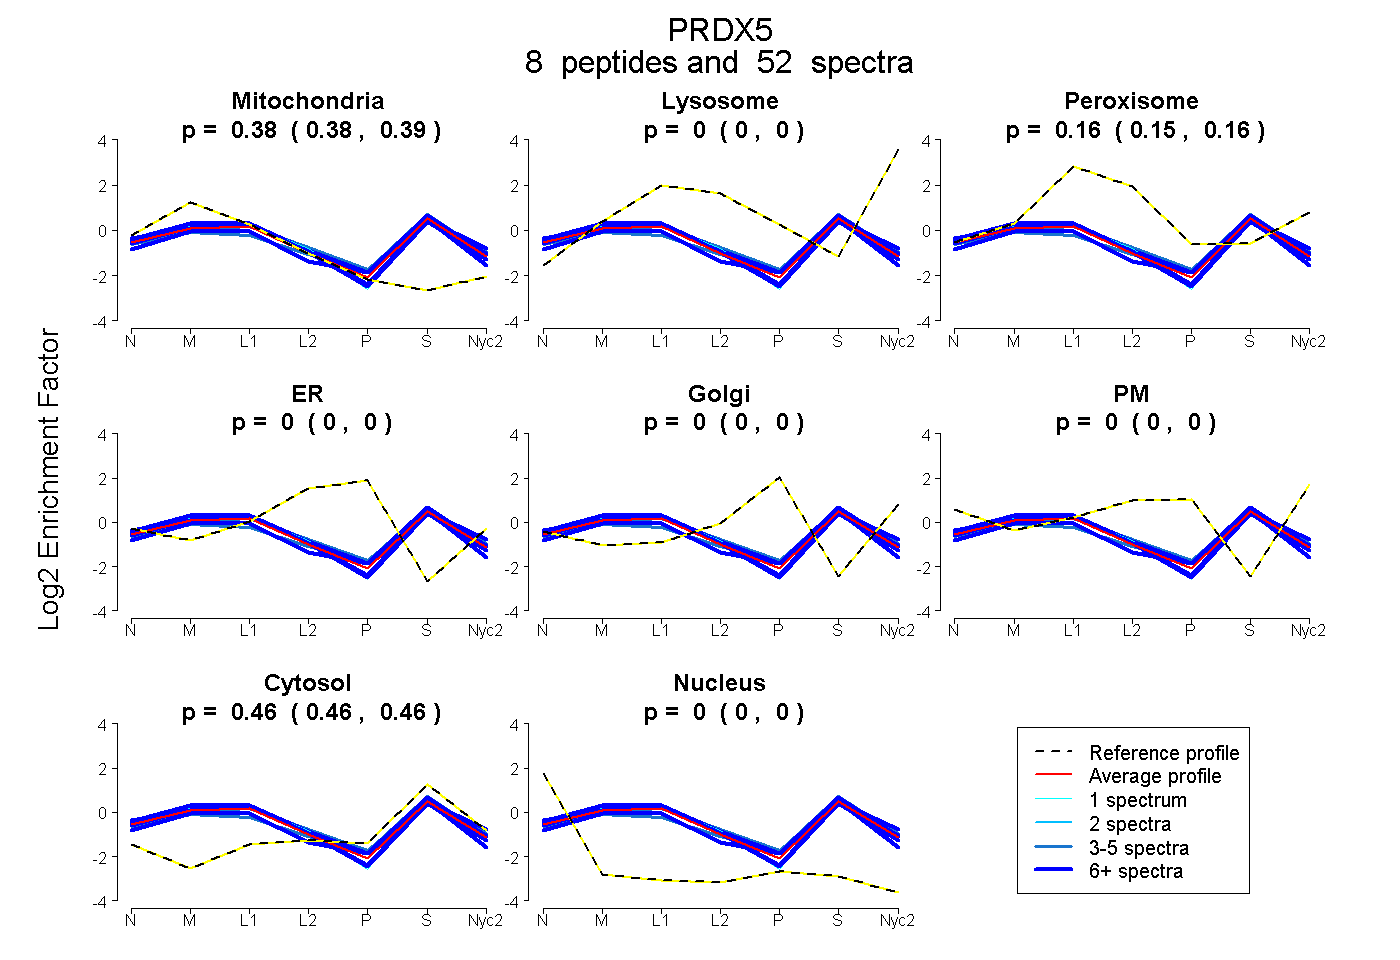
| Expt A |
8 peptides |
52 spectra |
|
0.383 0.378 | 0.387 |
0.000 0.000 | 0.000 |
0.158 0.153 | 0.162 |
0.000 0.000 | 0.000 |
0.000 0.000 | 0.000 |
0.000 0.000 | 0.000 |
0.459 0.456 | 0.462 |
0.000 0.000 | 0.000 |
| 1 spectrum, VGDTIPSVEVFEGEPGK | 0.422 | 0.000 | 0.153 | 0.000 | 0.000 | 0.000 | 0.425 | 0.000 | ||
| 3 spectra, ETDLLLDDSLVSLFGNR | 0.337 | 0.000 | 0.217 | 0.000 | 0.000 | 0.000 | 0.446 | 0.000 | ||
| 6 spectra, GVLFGVPGAFTPGCSK | 0.372 | 0.000 | 0.200 | 0.000 | 0.000 | 0.000 | 0.427 | 0.000 | ||
| 13 spectra, VNLAELFK | 0.448 | 0.000 | 0.147 | 0.000 | 0.000 | 0.000 | 0.405 | 0.000 | ||
| 5 spectra, AHQAEGK | 0.324 | 0.000 | 0.135 | 0.000 | 0.000 | 0.000 | 0.541 | 0.000 | ||
| 10 spectra, FSMVIDK | 0.353 | 0.000 | 0.110 | 0.000 | 0.000 | 0.000 | 0.537 | 0.000 | ||
| 8 spectra, VQLLADPTGAFGK | 0.374 | 0.000 | 0.190 | 0.000 | 0.000 | 0.000 | 0.437 | 0.000 | ||
| 6 spectra, THLPGFVEQAGALK | 0.402 | 0.000 | 0.161 | 0.000 | 0.000 | 0.000 | 0.437 | 0.000 |
| Plot | Mito | Lyso or Perox | ER | Golgi | PM | Cytosol | Nucleus | ||||||
| Expt B |
6 peptides |
30 spectra |
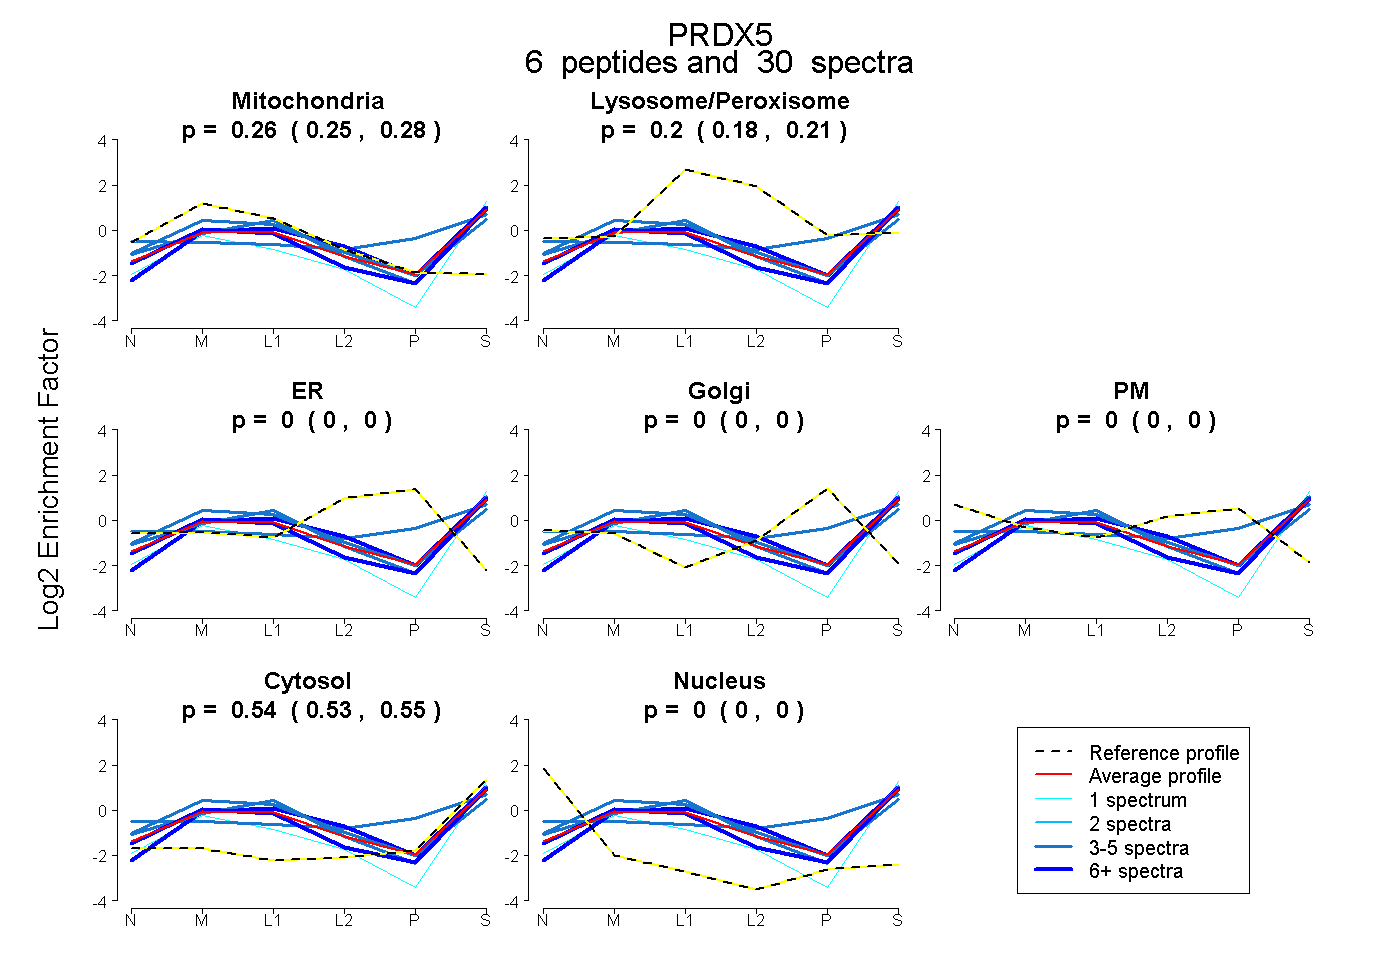 |
0.265 0.249 | 0.277 |
0.197 0.181 | 0.210 |
0.000 0.000 | 0.000 |
0.000 0.000 | 0.000 |
0.000 0.000 | 0.000 |
0.539 0.529 | 0.547 |
0.000 0.000 | 0.000 |
|||
| Plot | Lyso | Other | |||||||||||
| Expt C |
7 peptides |
221 spectra |
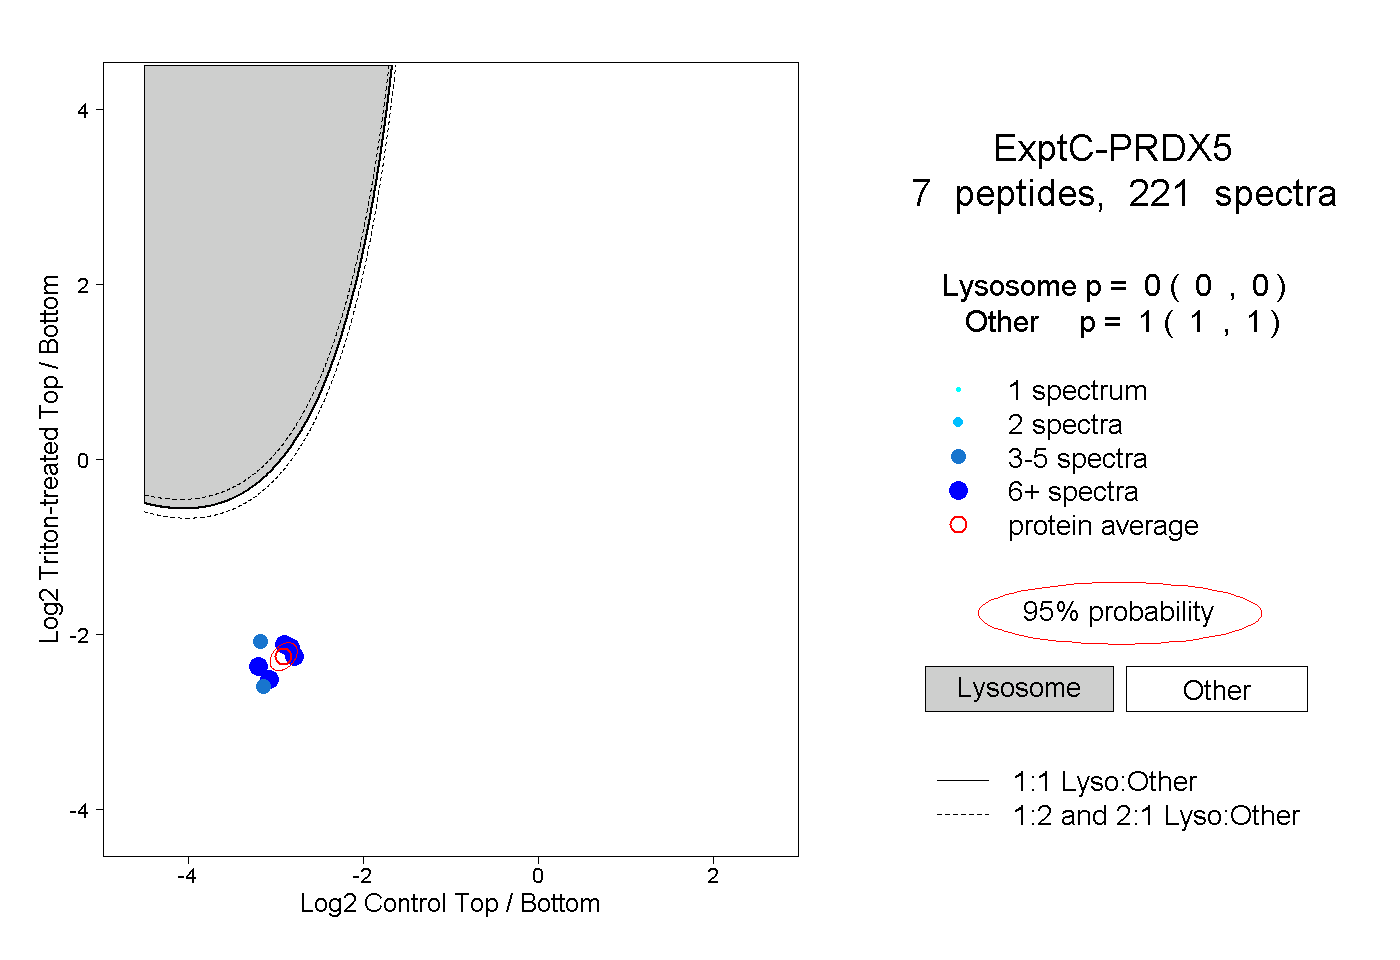 |
0.000 0.000 | 0.000 |
1.000 1.000 | 1.000 |
||||||||
| Plot | Lyso | Other | |||||||||||
| Expt D |
4 peptides |
13 spectra |
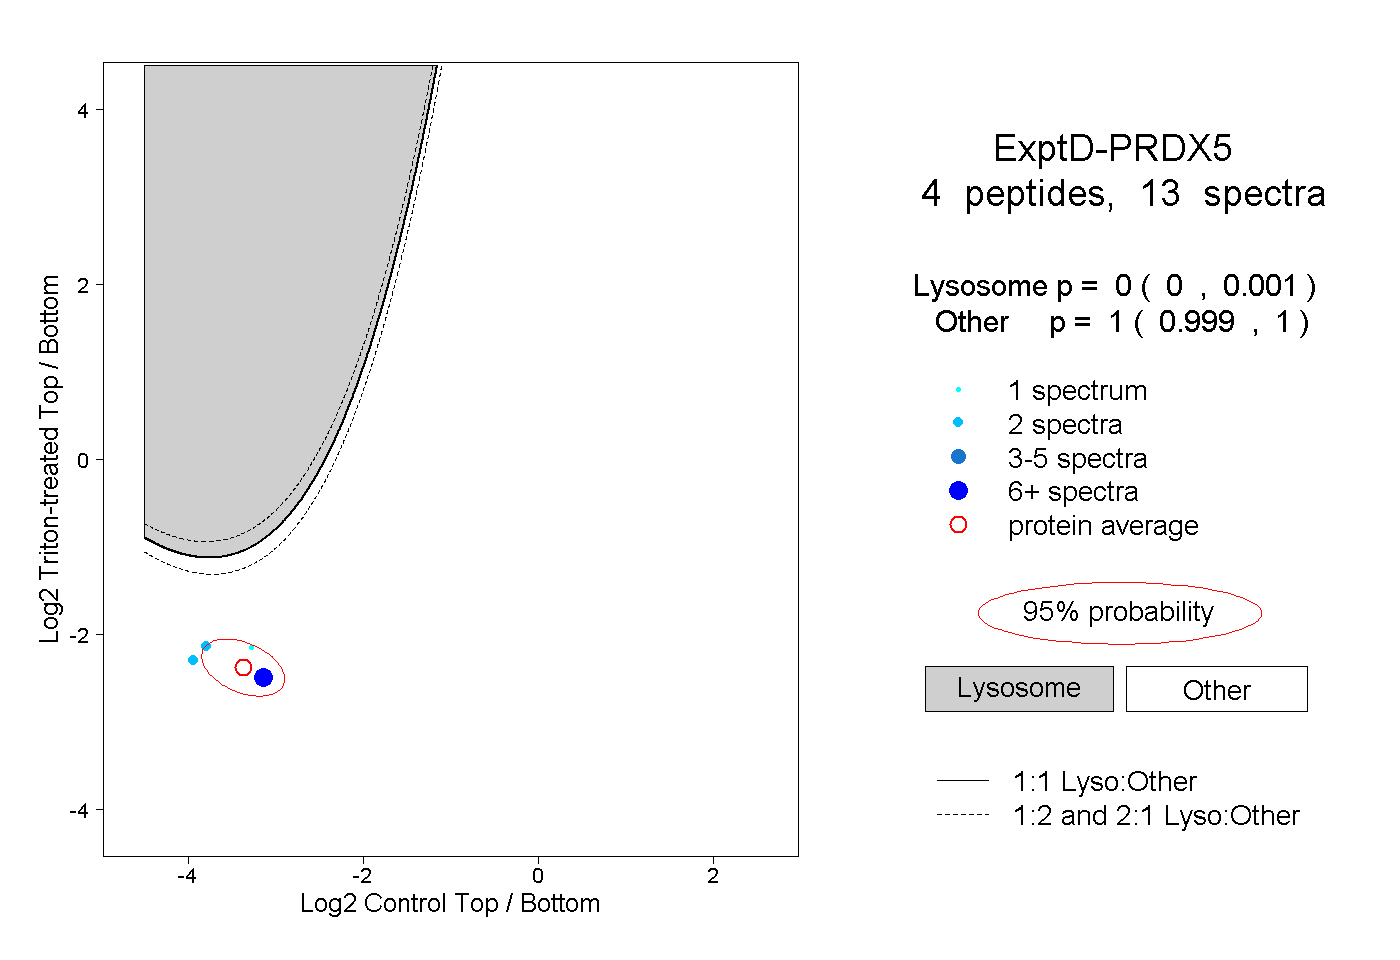 |
0.000 0.000 | 0.001 |
1.000 0.999 | 1.000 |