 5
5peptides
spectra
0.000 | 0.000
0.000 | 0.000
0.000 | 0.000
0.407 | 0.616
0.000 | 0.130
0.000 | 0.000
0.155 | 0.386
0.086 | 0.214
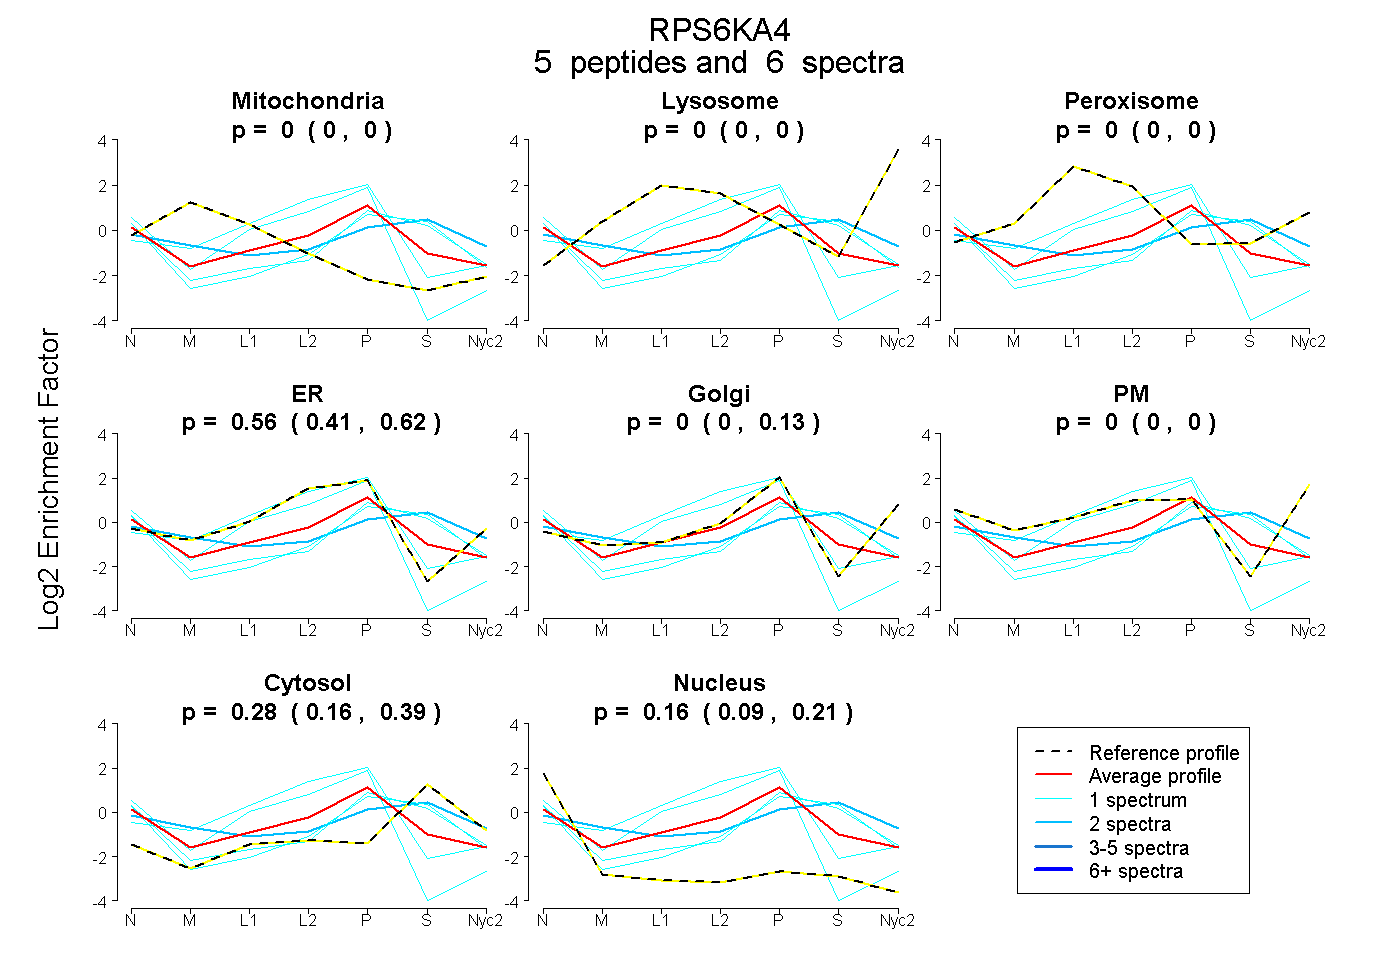
| Plot | Mito | Lyso | Perox | ER | Golgi | PM | Cytosol | Nucleus | |||||
| Expt A |
5 peptides |
6 spectra |
|
0.000 0.000 | 0.000 |
0.000 0.000 | 0.000 |
0.000 0.000 | 0.000 |
0.560 0.407 | 0.616 |
0.000 0.000 | 0.130 |
0.000 0.000 | 0.000 |
0.284 0.155 | 0.386 |
0.157 0.086 | 0.214 |
| 1 spectrum, IIDFGFAR | 0.000 | 0.000 | 0.000 | 0.026 | 0.327 | 0.000 | 0.479 | 0.168 | ||
| 1 spectrum, EFLTEEK | 0.037 | 0.000 | 0.000 | 0.909 | 0.000 | 0.000 | 0.050 | 0.004 | ||
| 1 spectrum, IPAPFRPQIR | 0.000 | 0.000 | 0.000 | 0.064 | 0.227 | 0.000 | 0.534 | 0.175 | ||
| 2 spectra, EVAALR | 0.131 | 0.000 | 0.026 | 0.000 | 0.253 | 0.049 | 0.542 | 0.000 | ||
| 1 spectrum, AGGHDAGK | 0.000 | 0.000 | 0.000 | 0.787 | 0.000 | 0.000 | 0.000 | 0.213 |