 6
6peptides
spectra
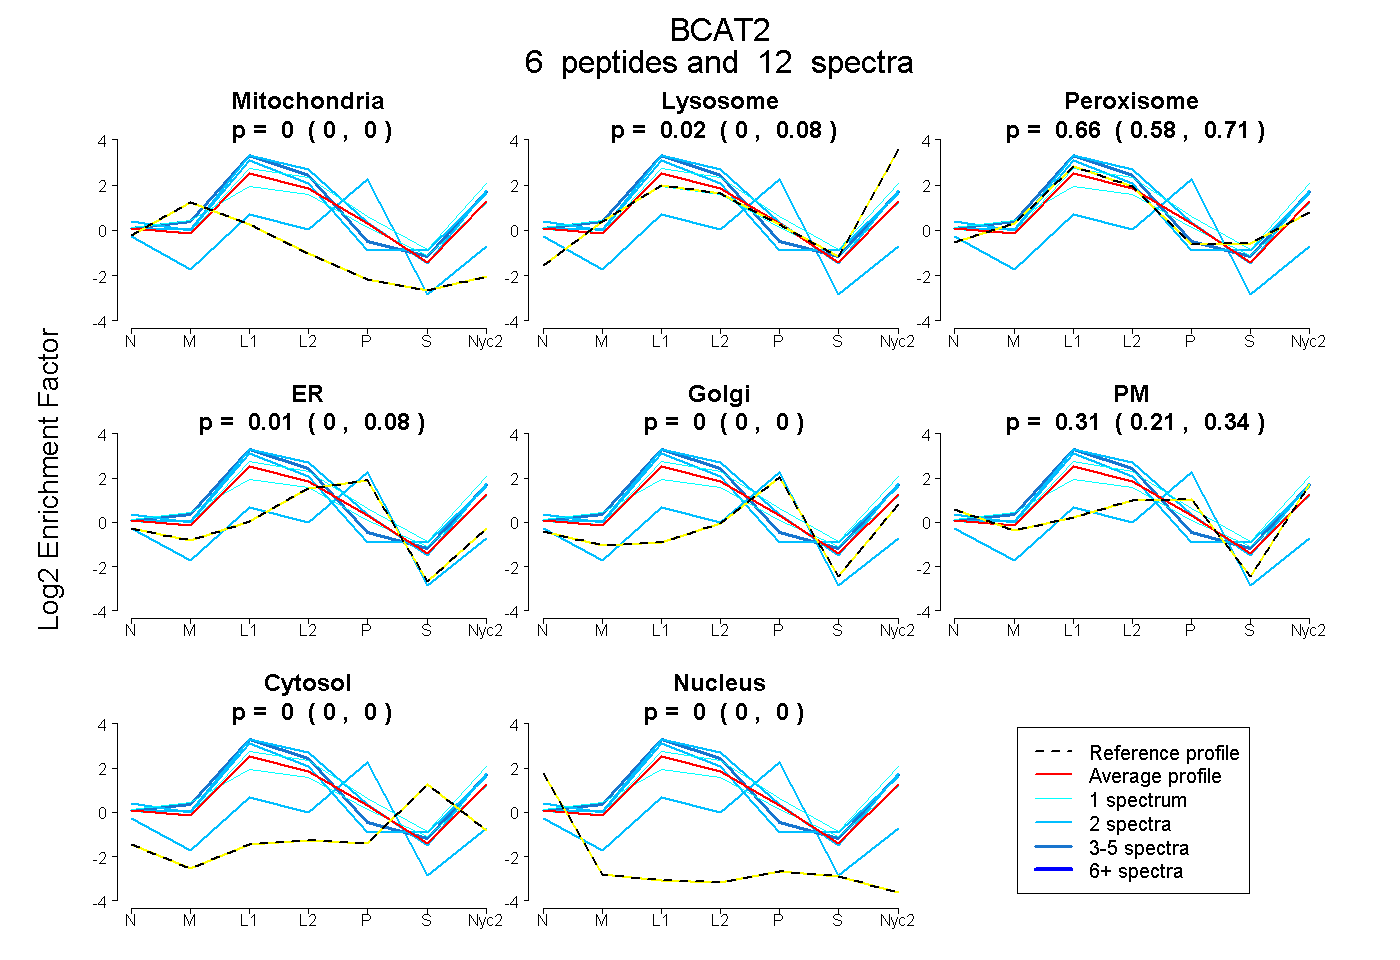
0.000 | 0.000
0.000 | 0.081
0.581 | 0.714
0.000 | 0.081
0.000 | 0.000
0.215 | 0.341
0.000 | 0.000
0.000 | 0.000
13peptides
spectra
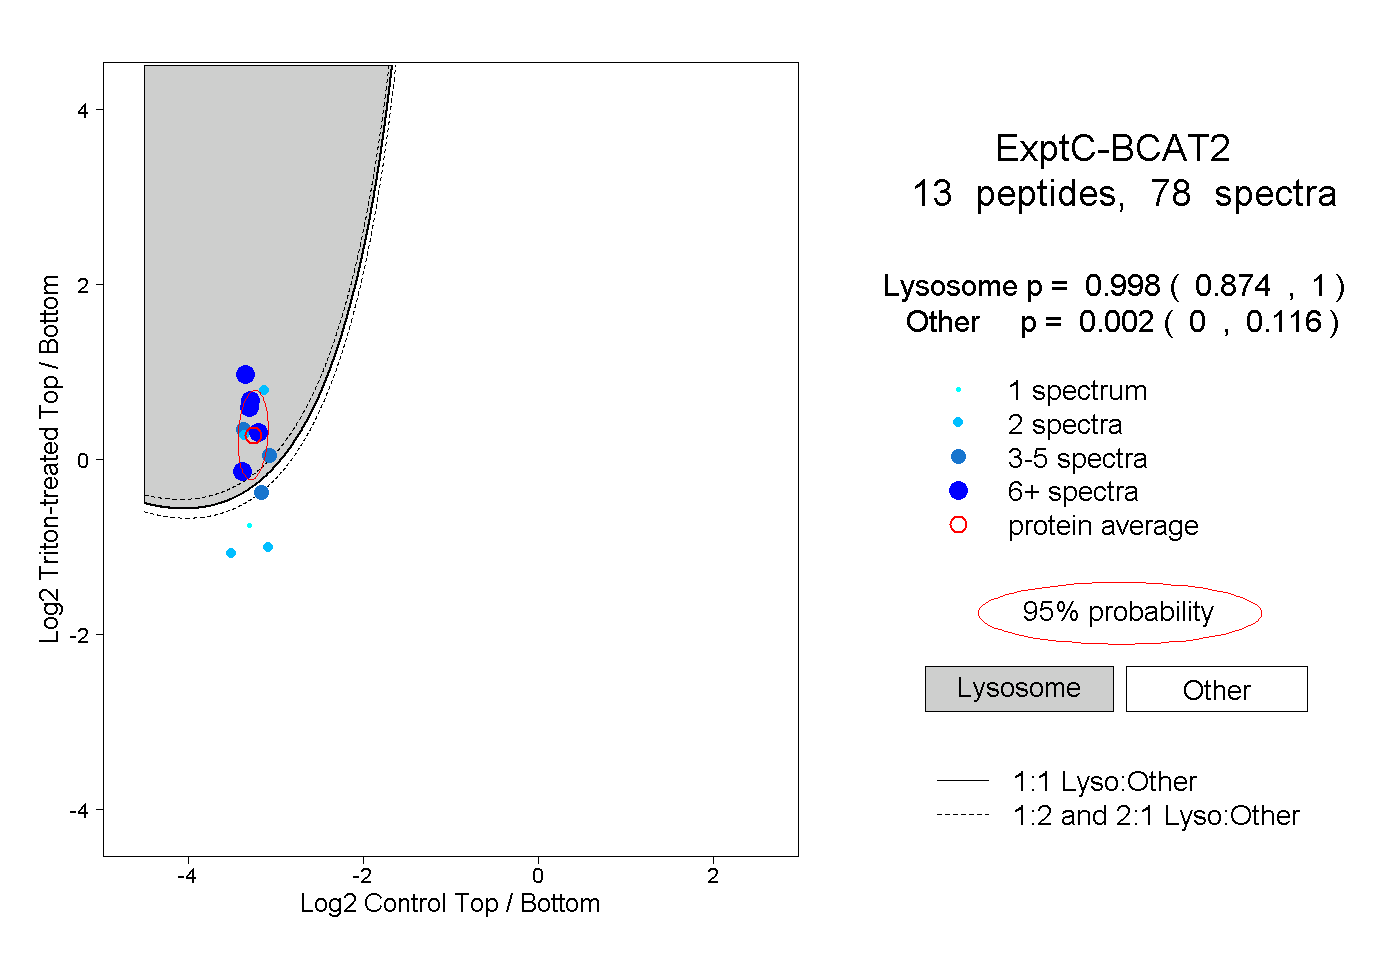
0.874 | 1.000
0.000 | 0.116
5peptides
spectra
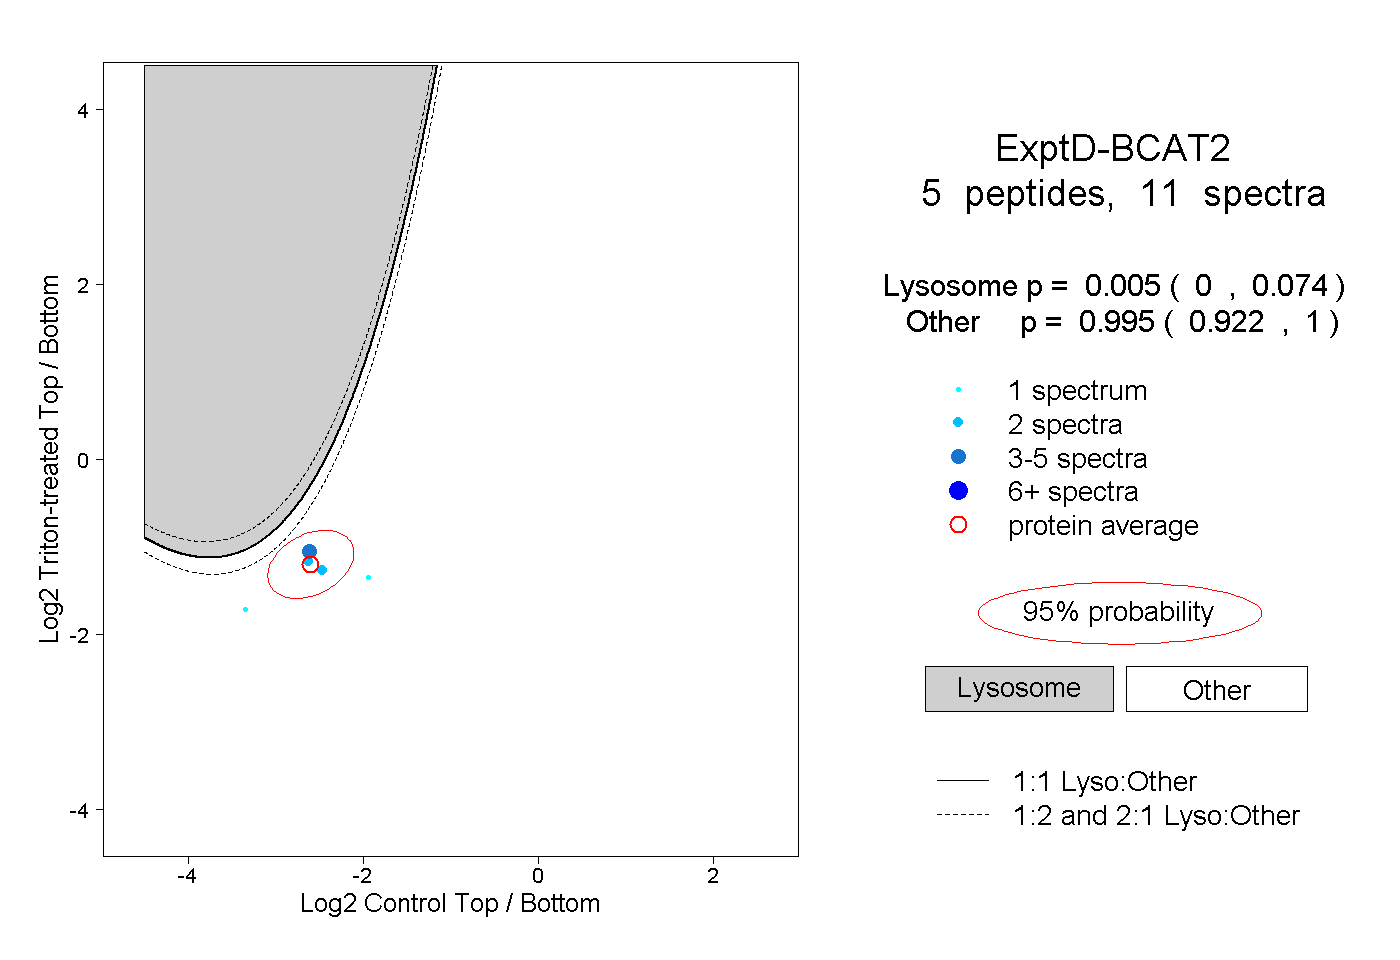
0.000 | 0.074
0.922 | 1.000