 20
20peptides
spectra
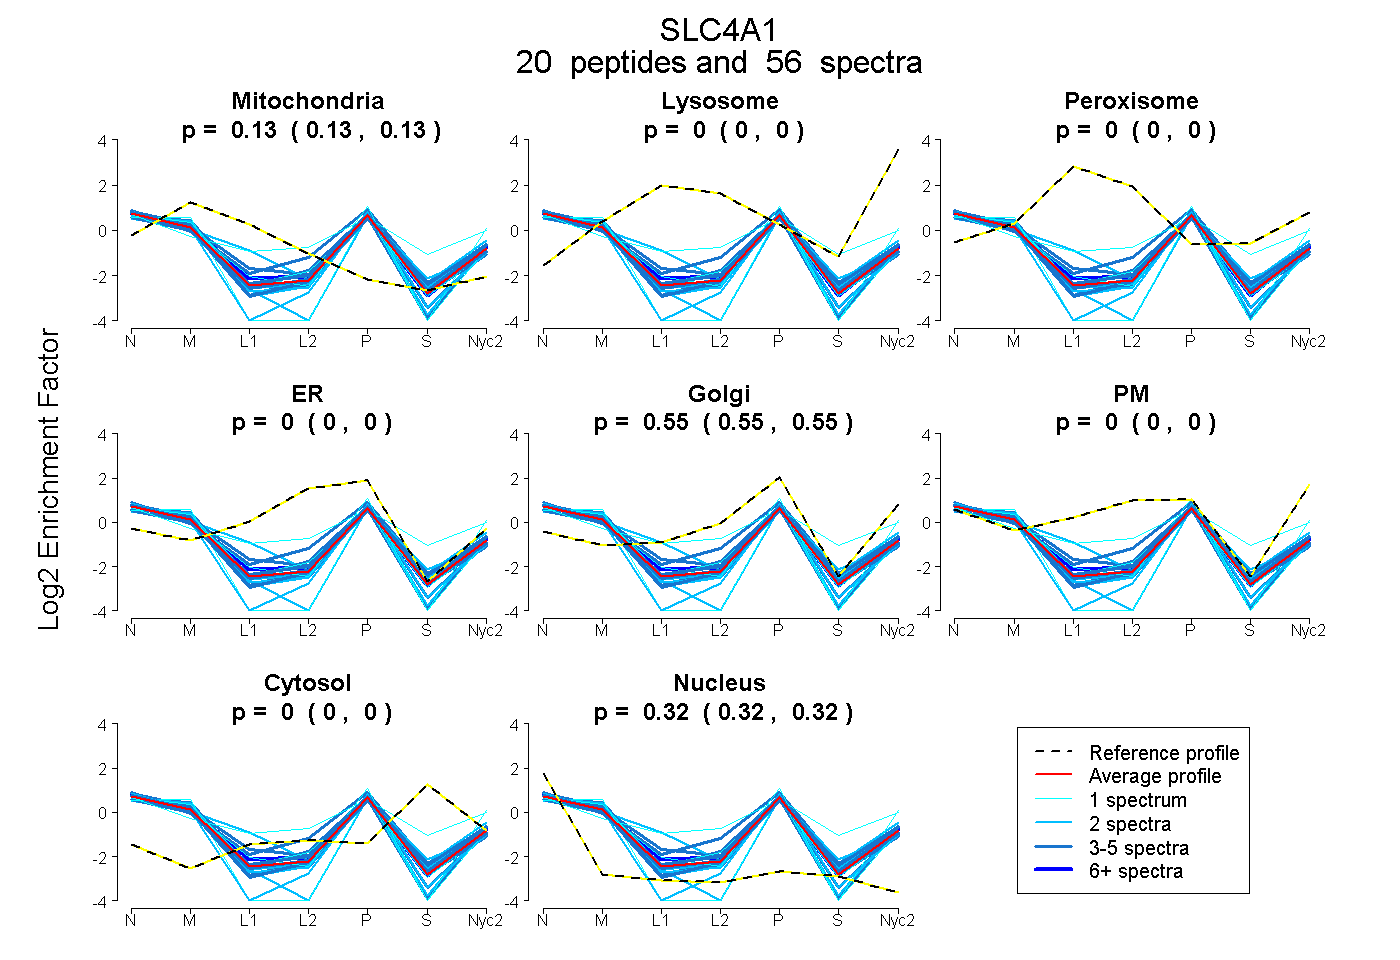
0.126 | 0.134
0.000 | 0.000
0.000 | 0.000
0.000 | 0.000
0.547 | 0.551
0.000 | 0.000
0.000 | 0.000
0.317 | 0.324
8peptides
spectra
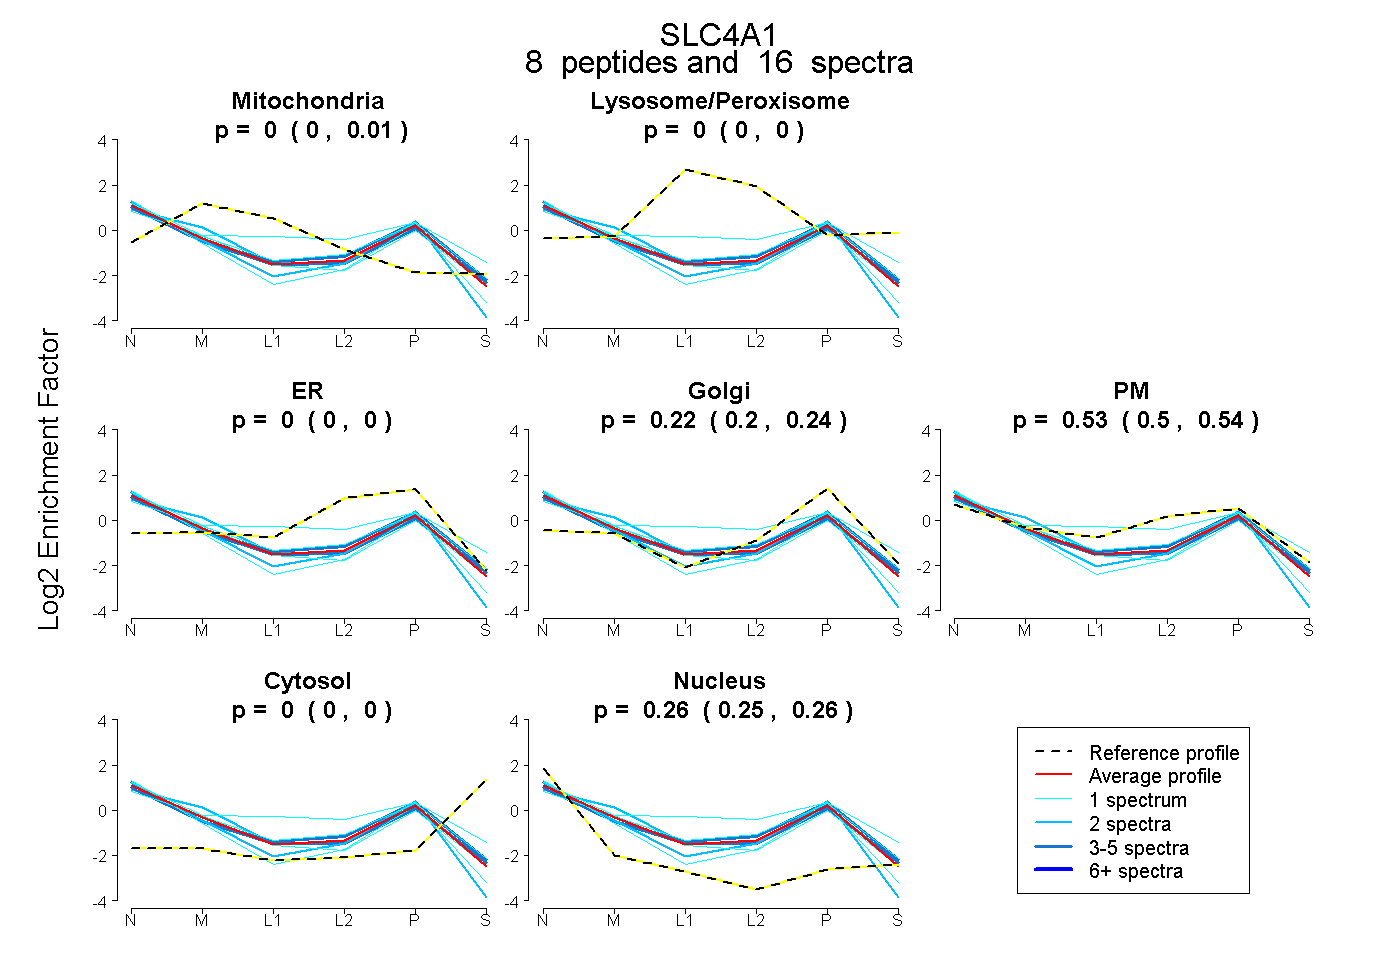
0.000 | 0.007
0.000 | 0.000
0.000 | 0.000
0.200 | 0.235
0.502 | 0.545
0.000 | 0.000
0.247 | 0.262
10peptides
spectra
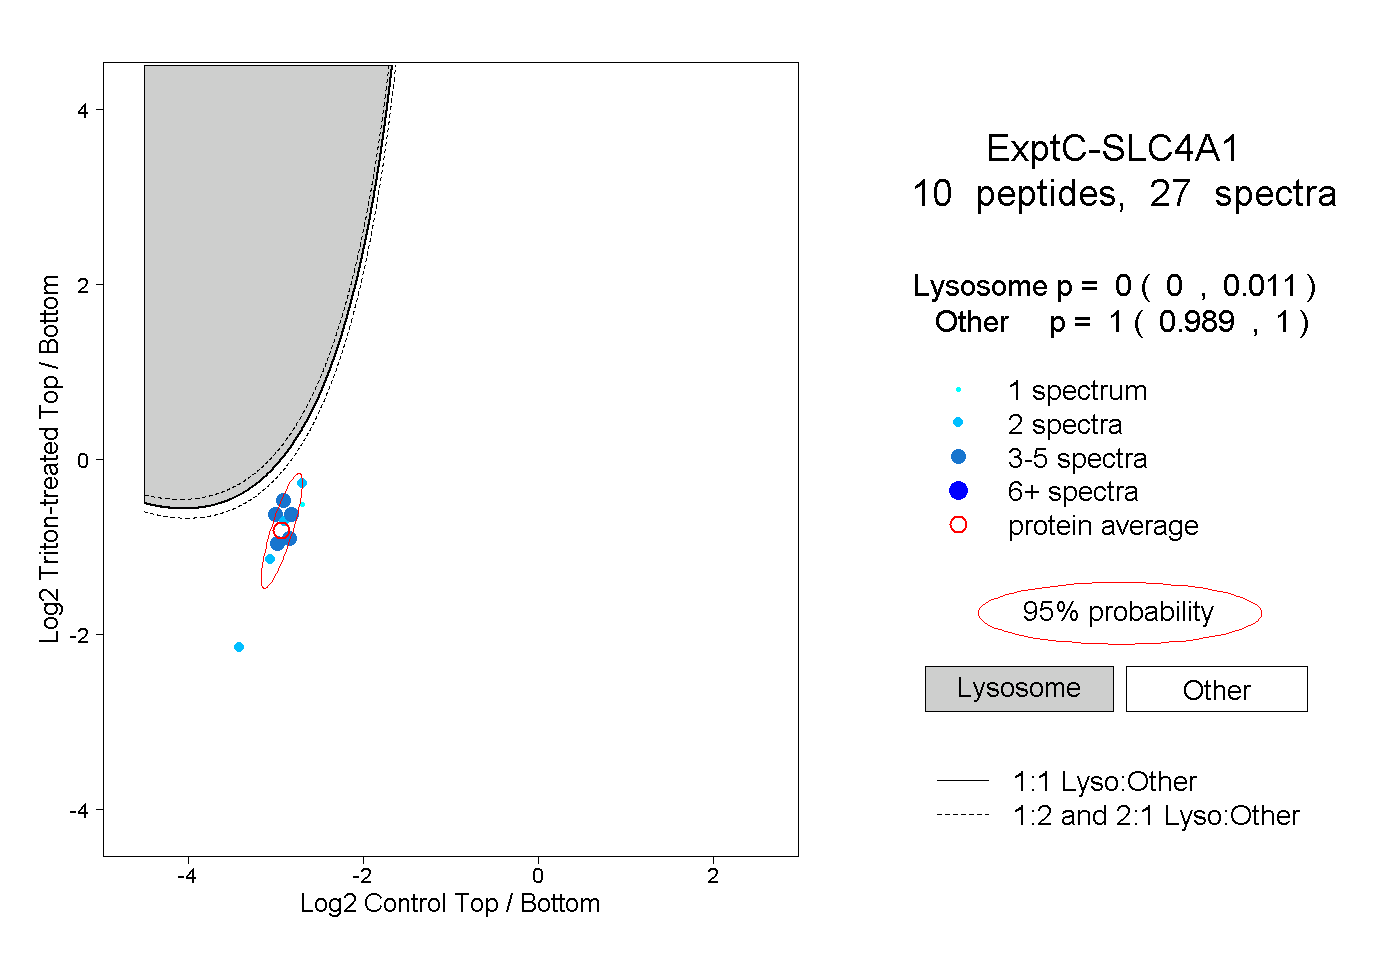
0.000 | 0.011
0.989 | 1.000
