 20
20peptides
spectra
0.126 | 0.134
0.000 | 0.000
0.000 | 0.000
0.000 | 0.000
0.547 | 0.551
0.000 | 0.000
0.000 | 0.000
0.317 | 0.324
| Plot | Mito | Lyso | Perox | ER | Golgi | PM | Cytosol | Nucleus | |||||
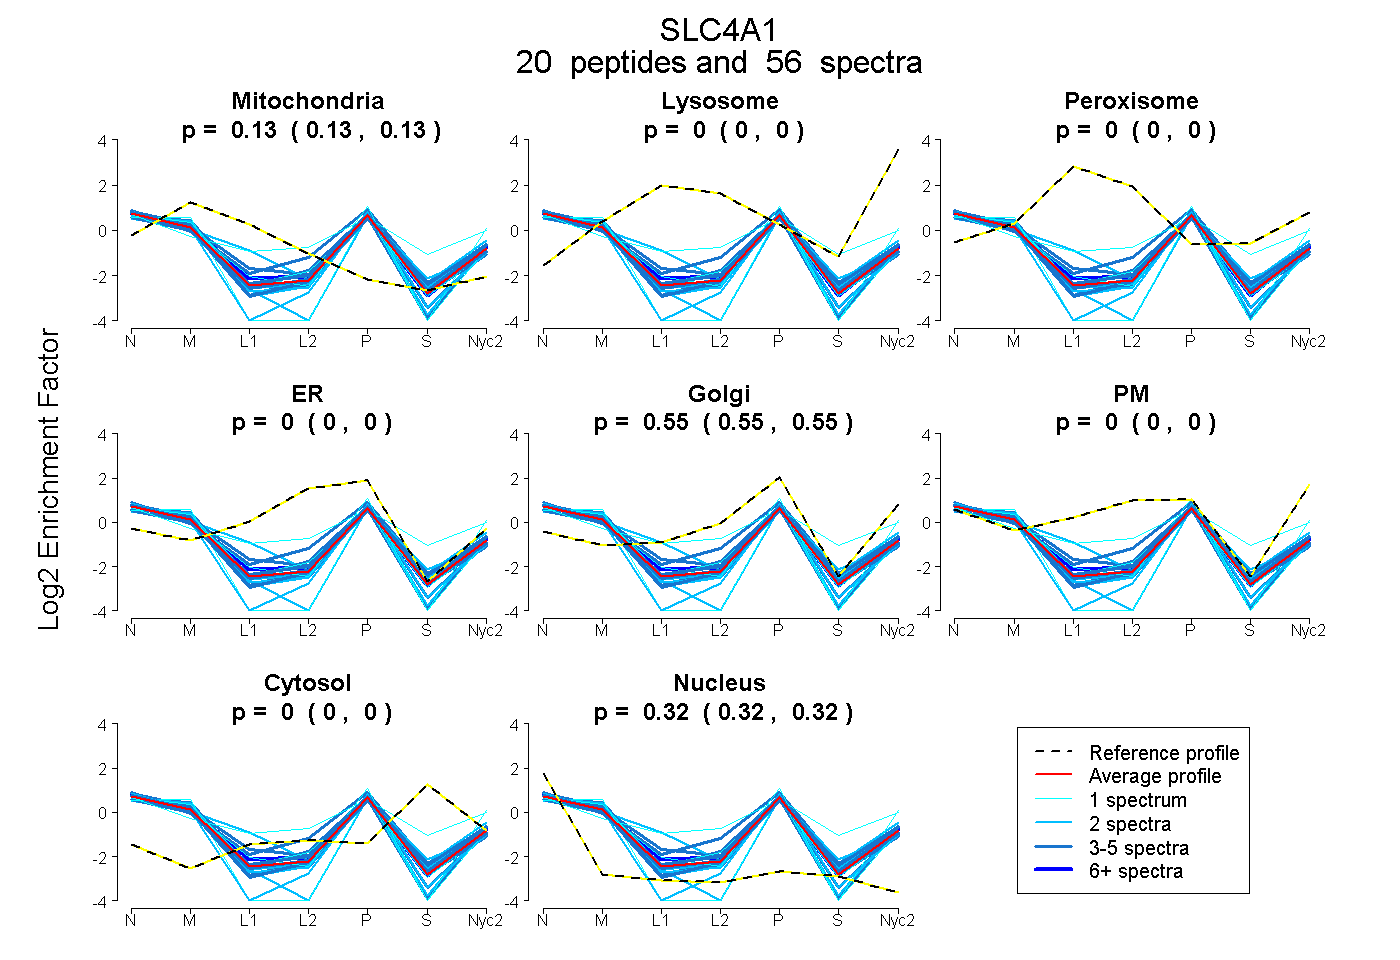
| Expt A |
20 peptides |
56 spectra |
|
0.130 0.126 | 0.134 |
0.000 0.000 | 0.000 |
0.000 0.000 | 0.000 |
0.000 0.000 | 0.000 |
0.549 0.547 | 0.551 |
0.000 0.000 | 0.000 |
0.000 0.000 | 0.000 |
0.321 0.317 | 0.324 |
| 1 spectrum, SHAEDLK | 0.187 | 0.000 | 0.000 | 0.000 | 0.531 | 0.000 | 0.000 | 0.282 | ||
| 3 spectra, LSVPDGLK | 0.121 | 0.000 | 0.000 | 0.000 | 0.513 | 0.000 | 0.000 | 0.366 | ||
| 1 spectrum, SGAPSEPLLPHQPSLETK | 0.118 | 0.000 | 0.000 | 0.000 | 0.579 | 0.000 | 0.000 | 0.303 | ||
| 1 spectrum, SVTHANALTVMGK | 0.117 | 0.000 | 0.000 | 0.000 | 0.268 | 0.328 | 0.198 | 0.089 | ||
| 2 spectra, NSTYFPGK | 0.120 | 0.000 | 0.000 | 0.000 | 0.525 | 0.000 | 0.000 | 0.355 | ||
| 3 spectra, VTASLAQSR | 0.123 | 0.000 | 0.000 | 0.000 | 0.559 | 0.000 | 0.000 | 0.319 | ||
| 5 spectra, NTYTQK | 0.073 | 0.000 | 0.000 | 0.000 | 0.566 | 0.000 | 0.000 | 0.361 | ||
| 2 spectra, ELELQCLDGDDAK | 0.087 | 0.000 | 0.000 | 0.000 | 0.470 | 0.000 | 0.000 | 0.444 | ||
| 1 spectrum, LYCAQAEGGSEEPSPSGILK | 0.000 | 0.000 | 0.000 | 0.000 | 0.557 | 0.000 | 0.000 | 0.443 | ||
| 3 spectra, GWVIHPLGLYNHFPK | 0.180 | 0.000 | 0.000 | 0.000 | 0.547 | 0.000 | 0.000 | 0.273 | ||
| 4 spectra, IFGGLIR | 0.097 | 0.000 | 0.000 | 0.000 | 0.557 | 0.000 | 0.000 | 0.346 | ||
| 2 spectra, NQELQWVEAAHWIGLEENLR | 0.000 | 0.000 | 0.000 | 0.000 | 0.528 | 0.000 | 0.000 | 0.472 | ||
| 3 spectra, YHPDVPFVK | 0.117 | 0.000 | 0.000 | 0.000 | 0.563 | 0.000 | 0.000 | 0.321 | ||
| 8 spectra, AAATLMTER | 0.163 | 0.000 | 0.000 | 0.000 | 0.549 | 0.000 | 0.000 | 0.288 | ||
| 2 spectra, LLDSFIYEDQIRPQDR | 0.126 | 0.000 | 0.000 | 0.000 | 0.549 | 0.000 | 0.000 | 0.325 | ||
| 2 spectra, ALLNLVPVQK | 0.261 | 0.000 | 0.000 | 0.000 | 0.574 | 0.000 | 0.000 | 0.165 | ||
| 2 spectra, DLEGVKPAVLTR | 0.116 | 0.000 | 0.000 | 0.000 | 0.531 | 0.000 | 0.000 | 0.352 | ||
| 4 spectra, ALLLK | 0.246 | 0.000 | 0.000 | 0.000 | 0.504 | 0.000 | 0.000 | 0.250 | ||
| 3 spectra, ASGPGAAAQIQEVK | 0.172 | 0.000 | 0.000 | 0.000 | 0.605 | 0.000 | 0.000 | 0.223 | ||
| 4 spectra, IPPNSETTLVLVGR | 0.097 | 0.000 | 0.000 | 0.000 | 0.529 | 0.000 | 0.000 | 0.374 |
| Plot | Mito | Lyso or Perox | ER | Golgi | PM | Cytosol | Nucleus | ||||||
| Expt B |
8 peptides |
16 spectra |
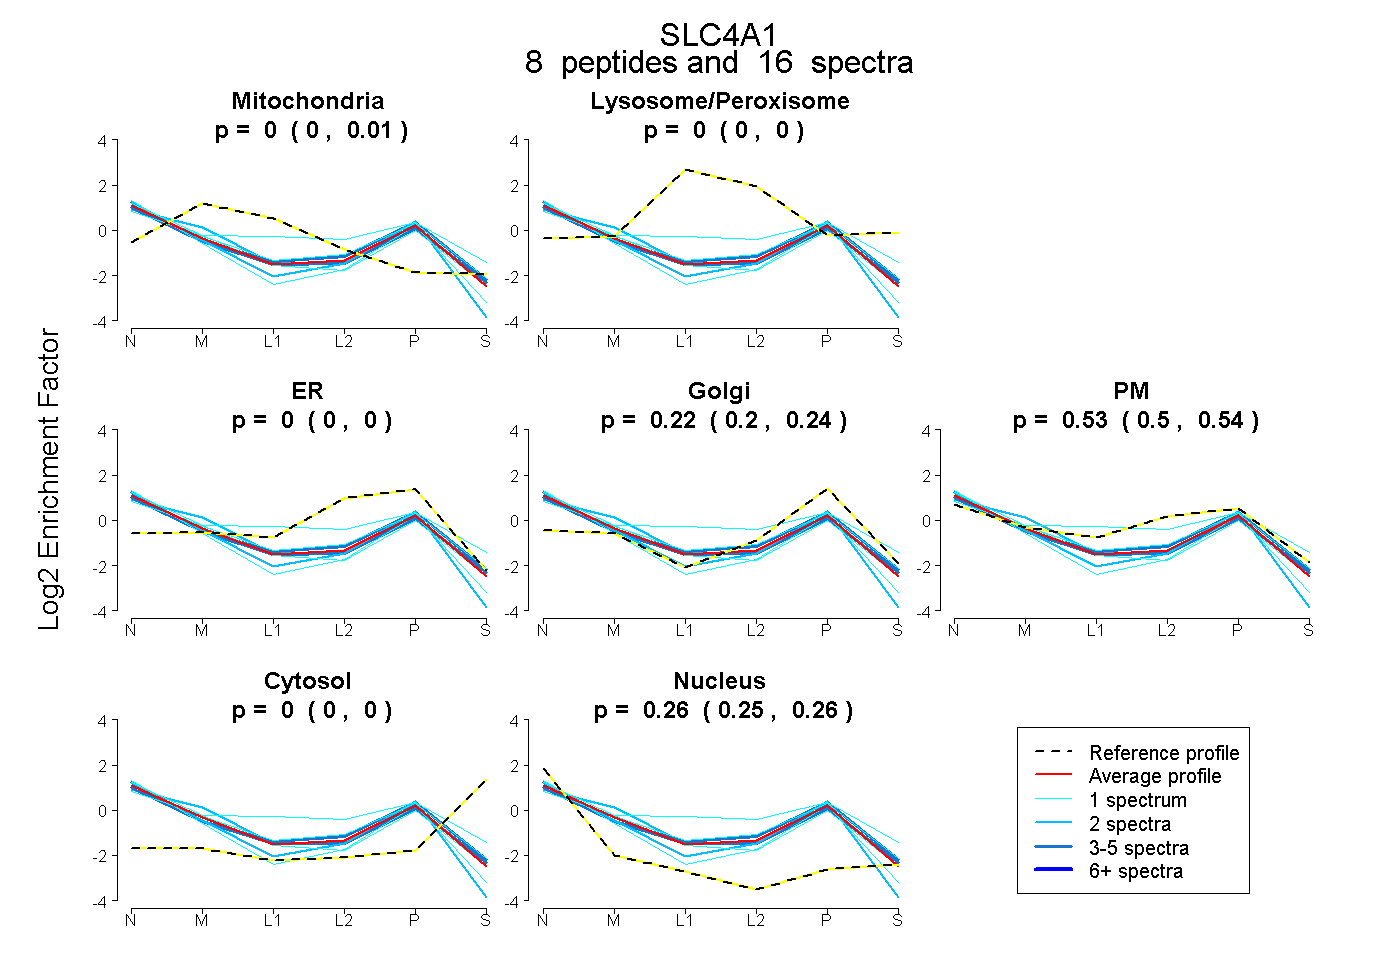 |
0.000 0.000 | 0.007 |
0.000 0.000 | 0.000 |
0.000 0.000 | 0.000 |
0.219 0.200 | 0.235 |
0.525 0.502 | 0.545 |
0.000 0.000 | 0.000 |
0.255 0.247 | 0.262 |
|||
| Plot | Lyso | Other | |||||||||||
| Expt C |
10 peptides |
27 spectra |
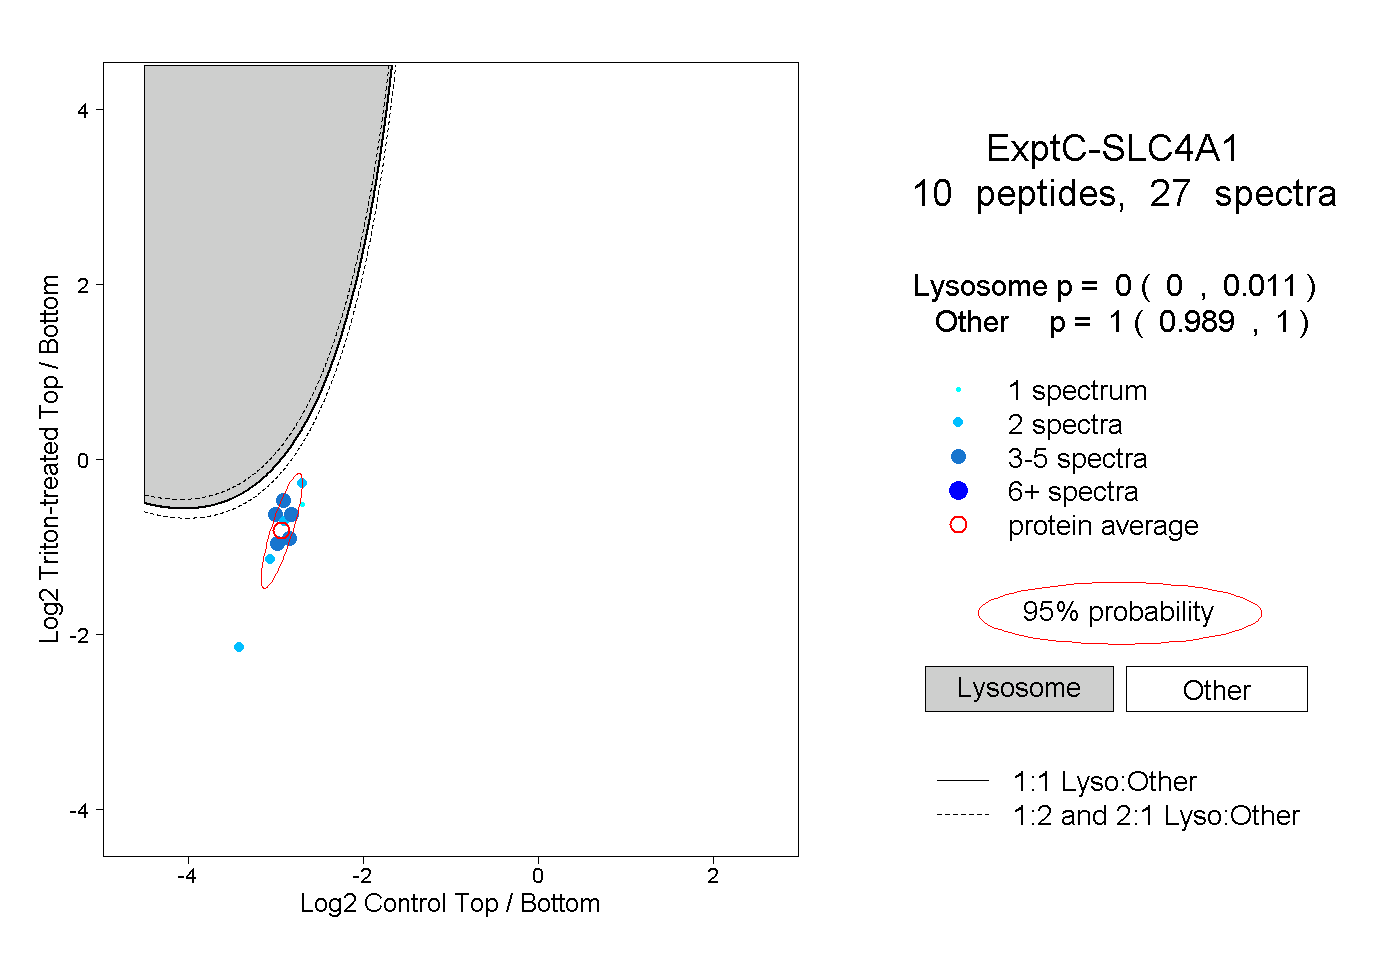 |
0.000 0.000 | 0.011 |
1.000 0.989 | 1.000 |
||||||||
| Plot | Lyso | Other | |||||||||||
| Expt D |
6 peptides |
10 spectra |
 |
0.000 0.000 | 0.006 |
1.000 0.994 | 1.000 |