15
15peptides
spectra
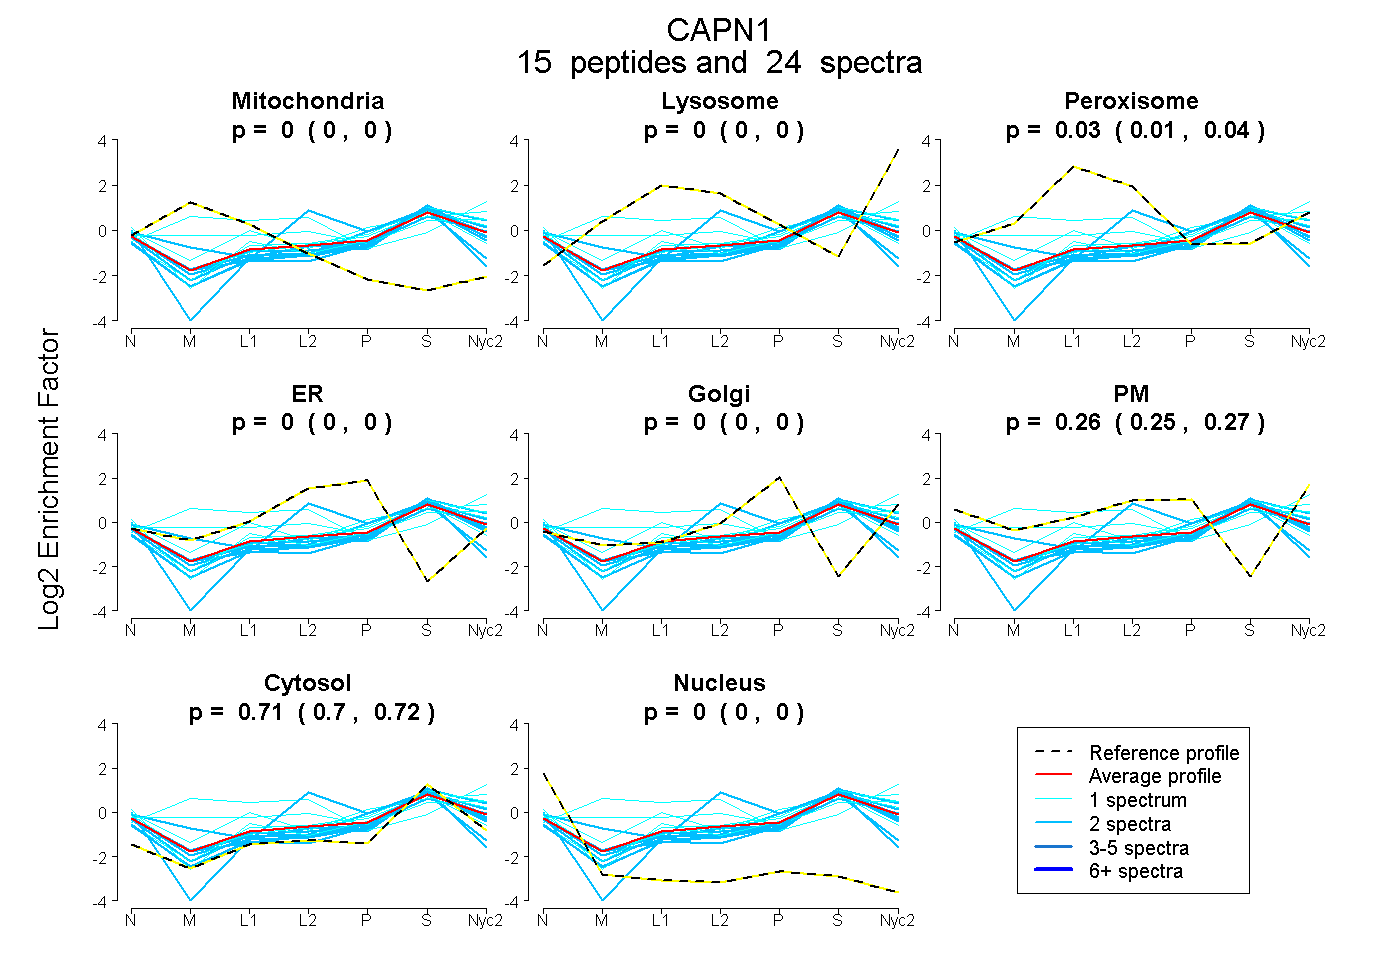
0.000 | 0.000
0.000 | 0.000
0.014 | 0.041
0.000 | 0.000
0.000 | 0.000
0.252 | 0.273
0.698 | 0.717
0.000 | 0.000
5peptides
spectra
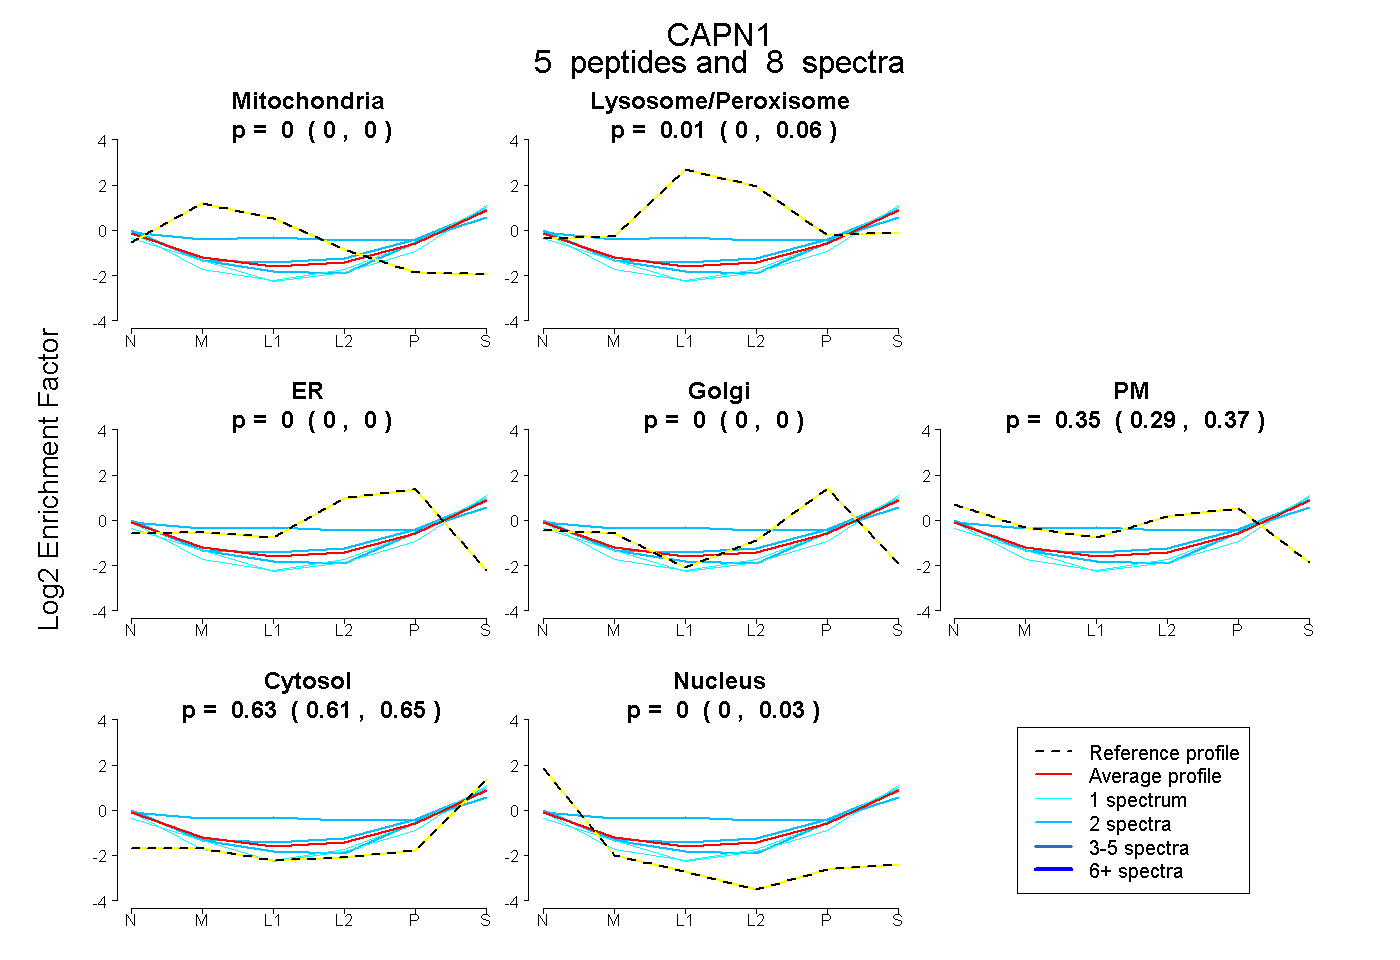
0.000 | 0.000
0.000 | 0.064
0.000 | 0.000
0.000 | 0.000
0.291 | 0.367
0.607 | 0.648
0.000 | 0.026