 2
2peptides
spectra
0.000 | 0.000
0.062 | 0.150
0.000 | 0.010
0.000 | 0.000
0.000 | 0.000
0.779 | 0.881
0.017 | 0.086
0.000 | 0.000
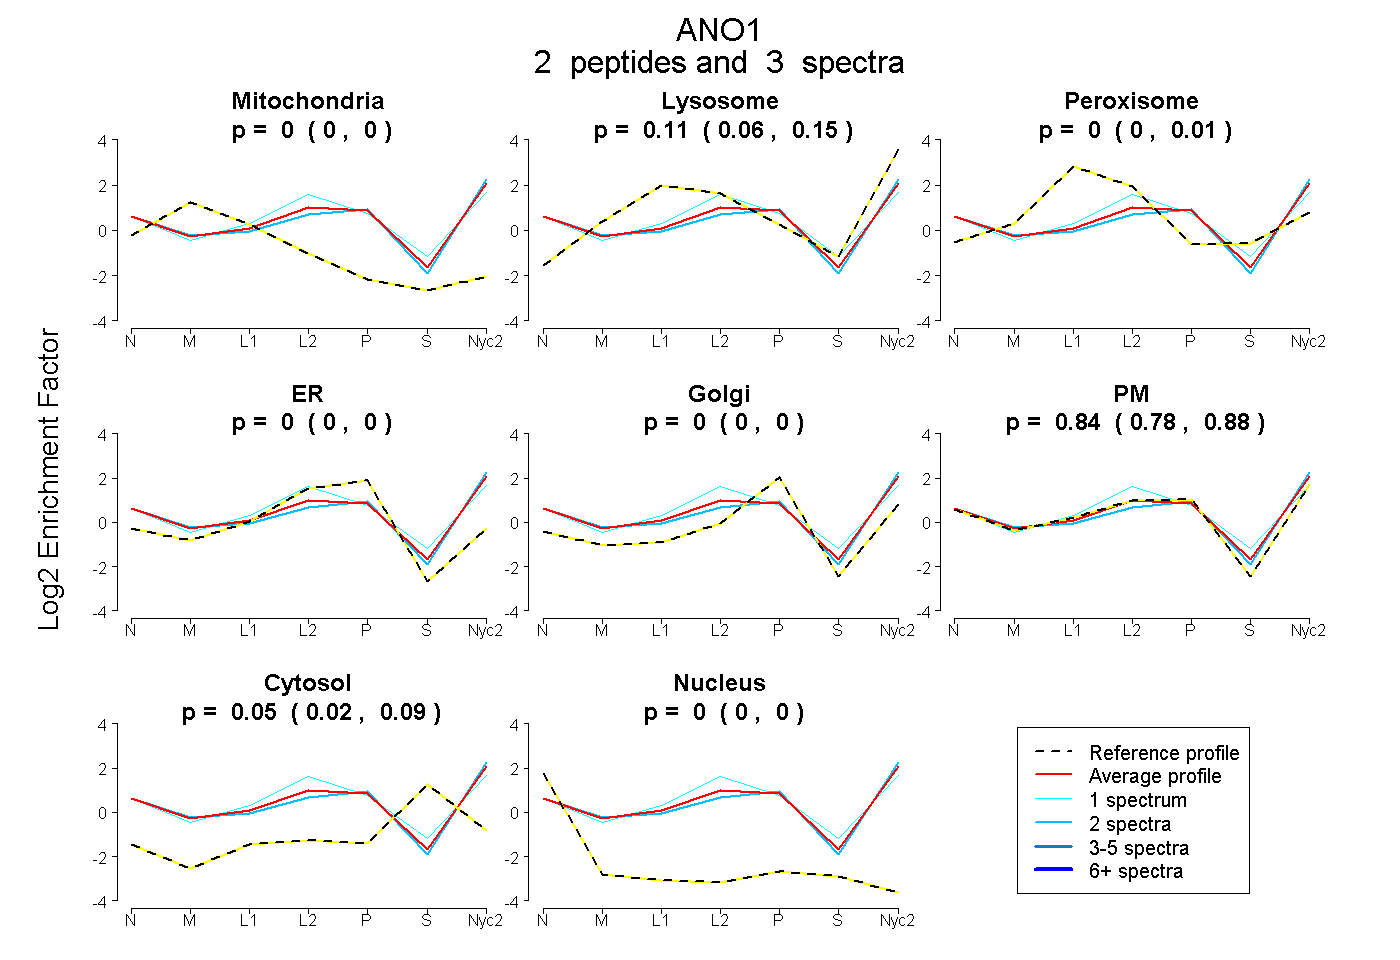
| Plot | Mito | Lyso | Perox | ER | Golgi | PM | Cytosol | Nucleus | |||||
| Expt A |
2 peptides |
3 spectra |
|
0.000 0.000 | 0.000 |
0.110 0.062 | 0.150 |
0.000 0.000 | 0.010 |
0.000 0.000 | 0.000 |
0.000 0.000 | 0.000 |
0.835 0.779 | 0.881 |
0.055 0.017 | 0.086 |
0.000 0.000 | 0.000 |
| 2 spectra, RPVAIR | 0.000 | 0.087 | 0.000 | 0.000 | 0.000 | 0.878 | 0.036 | 0.000 | ||
| 1 spectrum, IHAPWHVLCR | 0.000 | 0.035 | 0.174 | 0.000 | 0.000 | 0.728 | 0.062 | 0.000 |