 3
3peptides
spectra
0.000 | 0.000
0.040 | 0.323
0.000 | 0.209
0.000 | 0.000
0.000 | 0.338
0.150 | 0.535
0.121 | 0.260
0.000 | 0.000
1peptide
spectrum
NA | NA
NA | NA
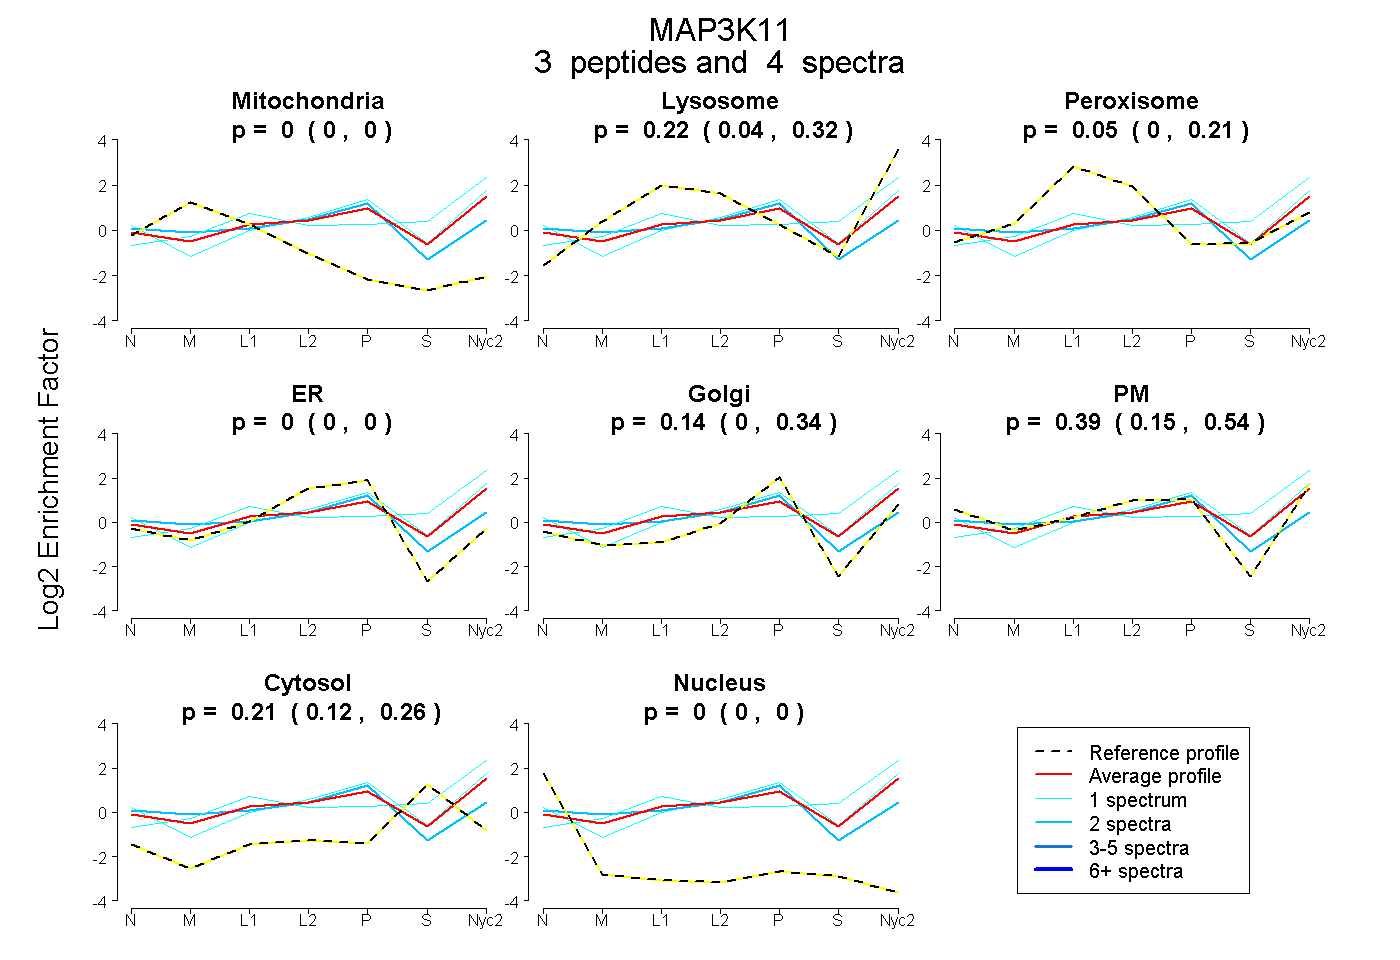
| Plot | Mito | Lyso | Perox | ER | Golgi | PM | Cytosol | Nucleus | |||||
| Expt A |
3 peptides |
4 spectra |
|
0.000 0.000 | 0.000 |
0.216 0.040 | 0.323 |
0.052 0.000 | 0.209 |
0.000 0.000 | 0.000 |
0.140 0.000 | 0.338 |
0.387 0.150 | 0.535 |
0.206 0.121 | 0.260 |
0.000 0.000 | 0.000 |
||
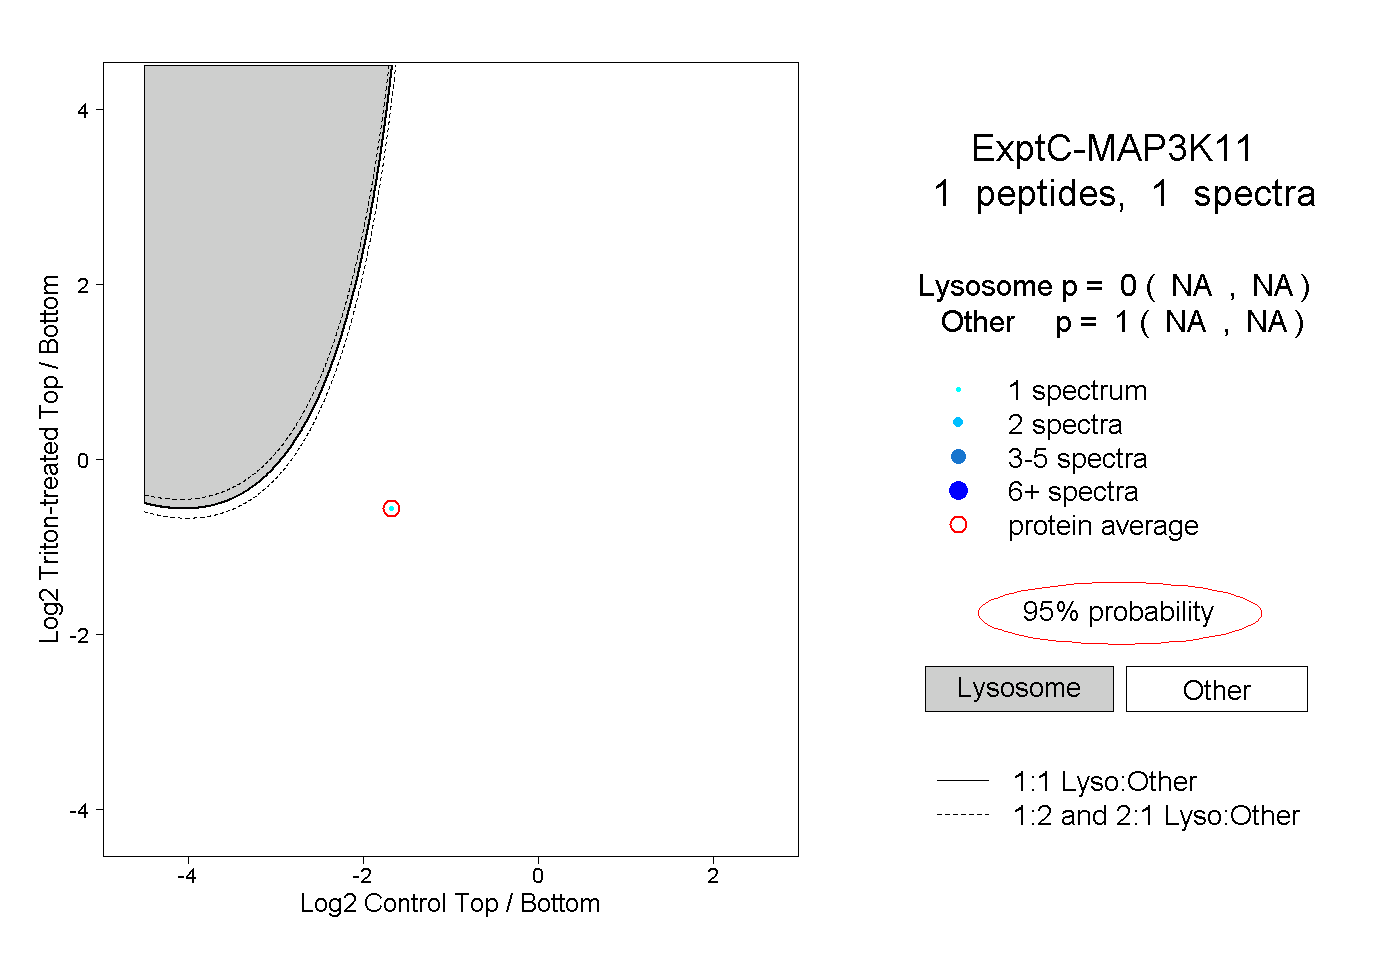
| Plot | Lyso | Other | |||||||||||
| Expt C |
1 peptide |
1 spectrum |
|
0.000 NA | NA |
1.000 NA | NA |