 3
3peptides
spectra
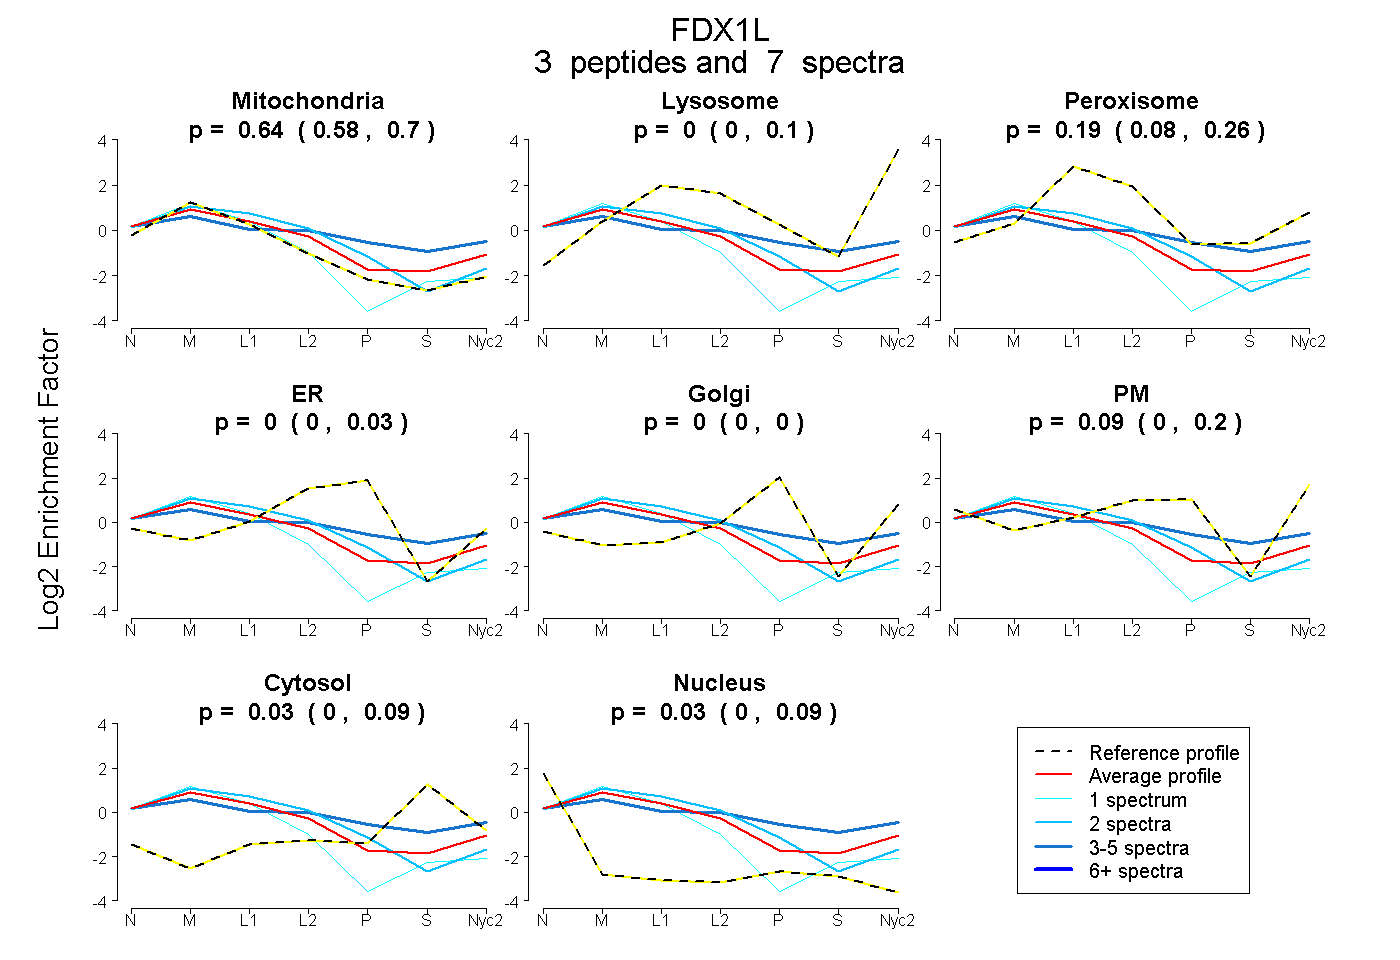
0.576 | 0.702
0.000 | 0.100
0.084 | 0.260
0.000 | 0.035
0.000 | 0.000
0.000 | 0.200
0.000 | 0.092
0.000 | 0.087
1peptide
spectrum
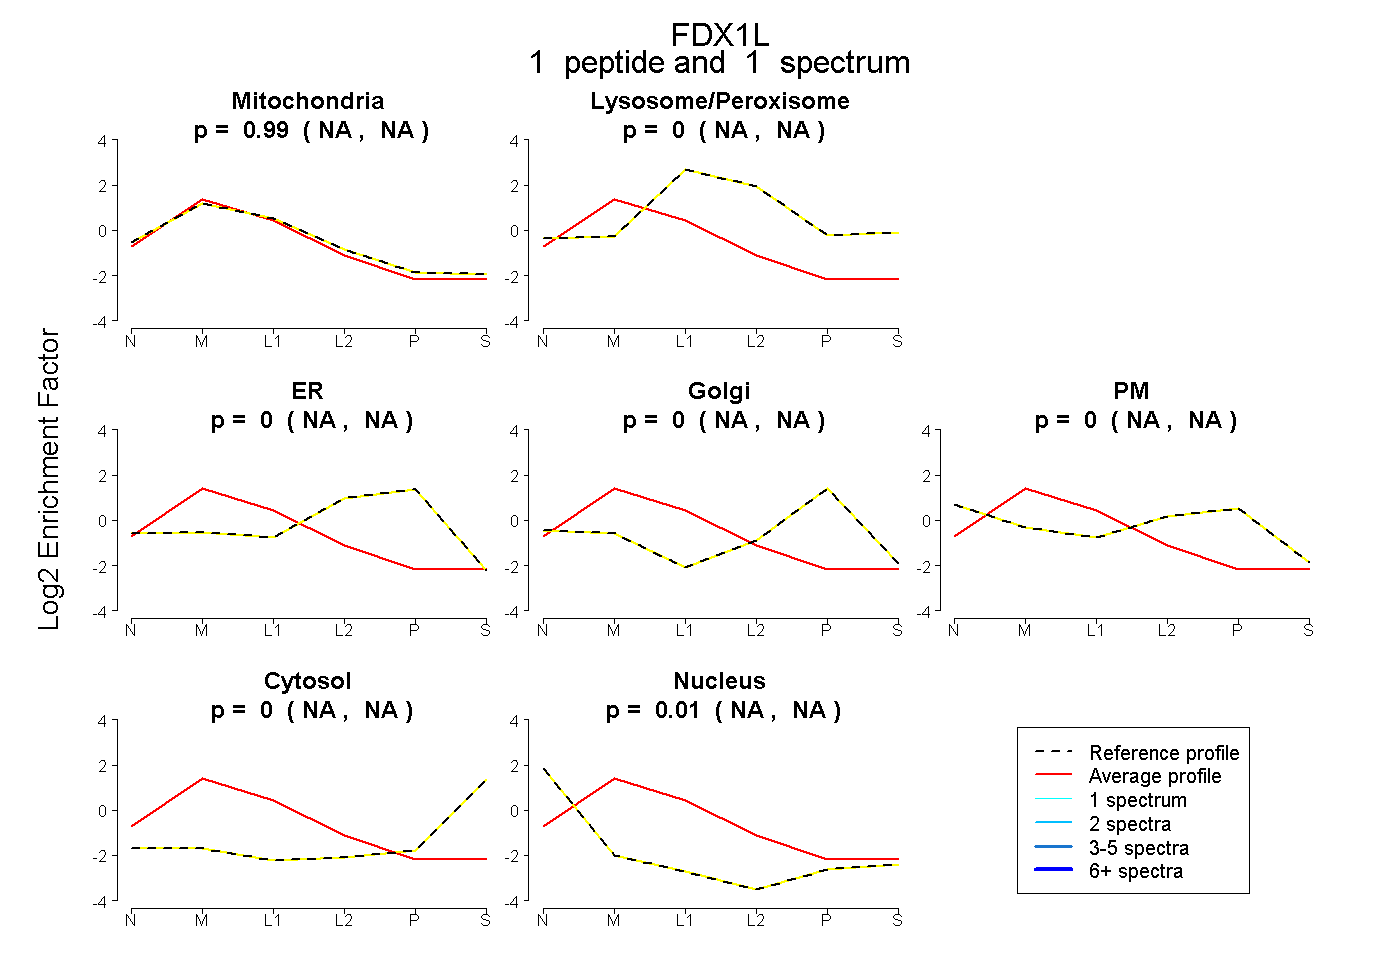
NA | NA
NA | NA
NA | NA
NA | NA
NA | NA
NA | NA
NA | NA
4peptides
spectra
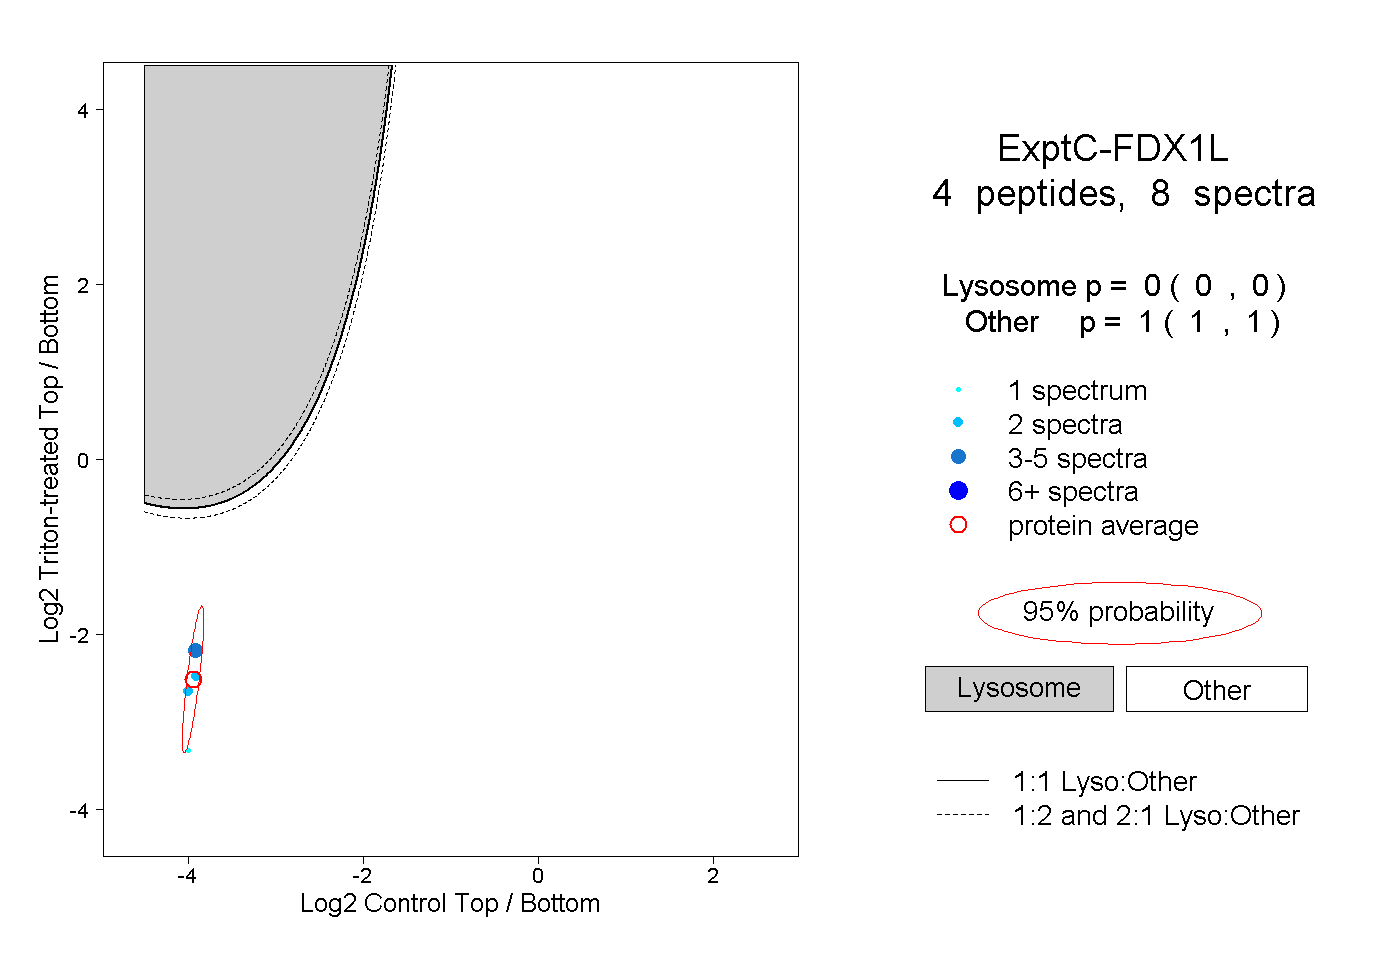
0.000 | 0.000
1.000 | 1.000
2peptides
spectra
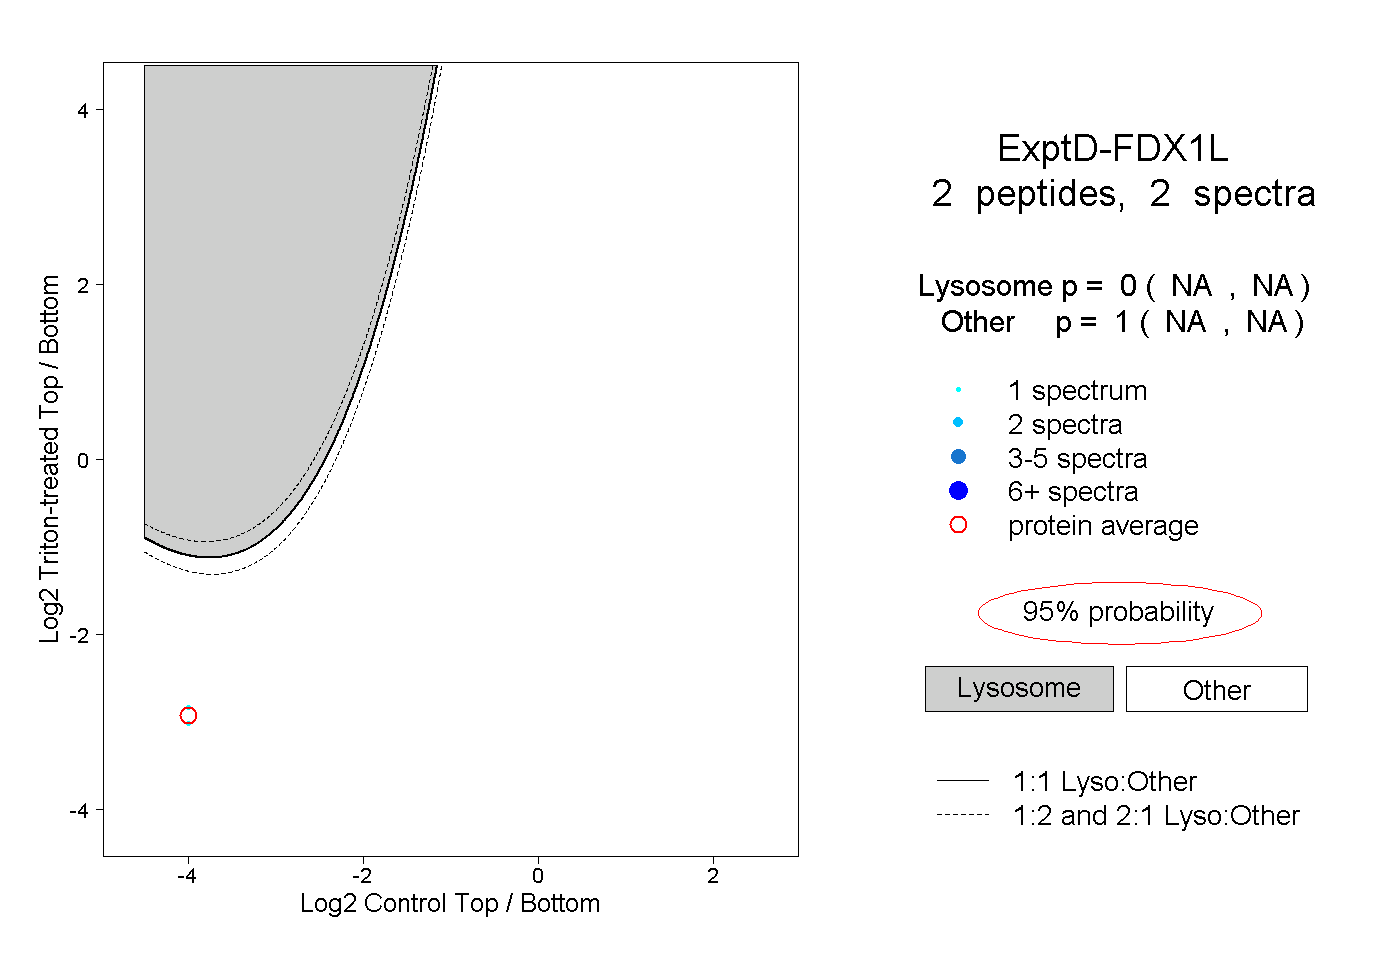
NA | NA
NA | NA