18
18peptides
spectra
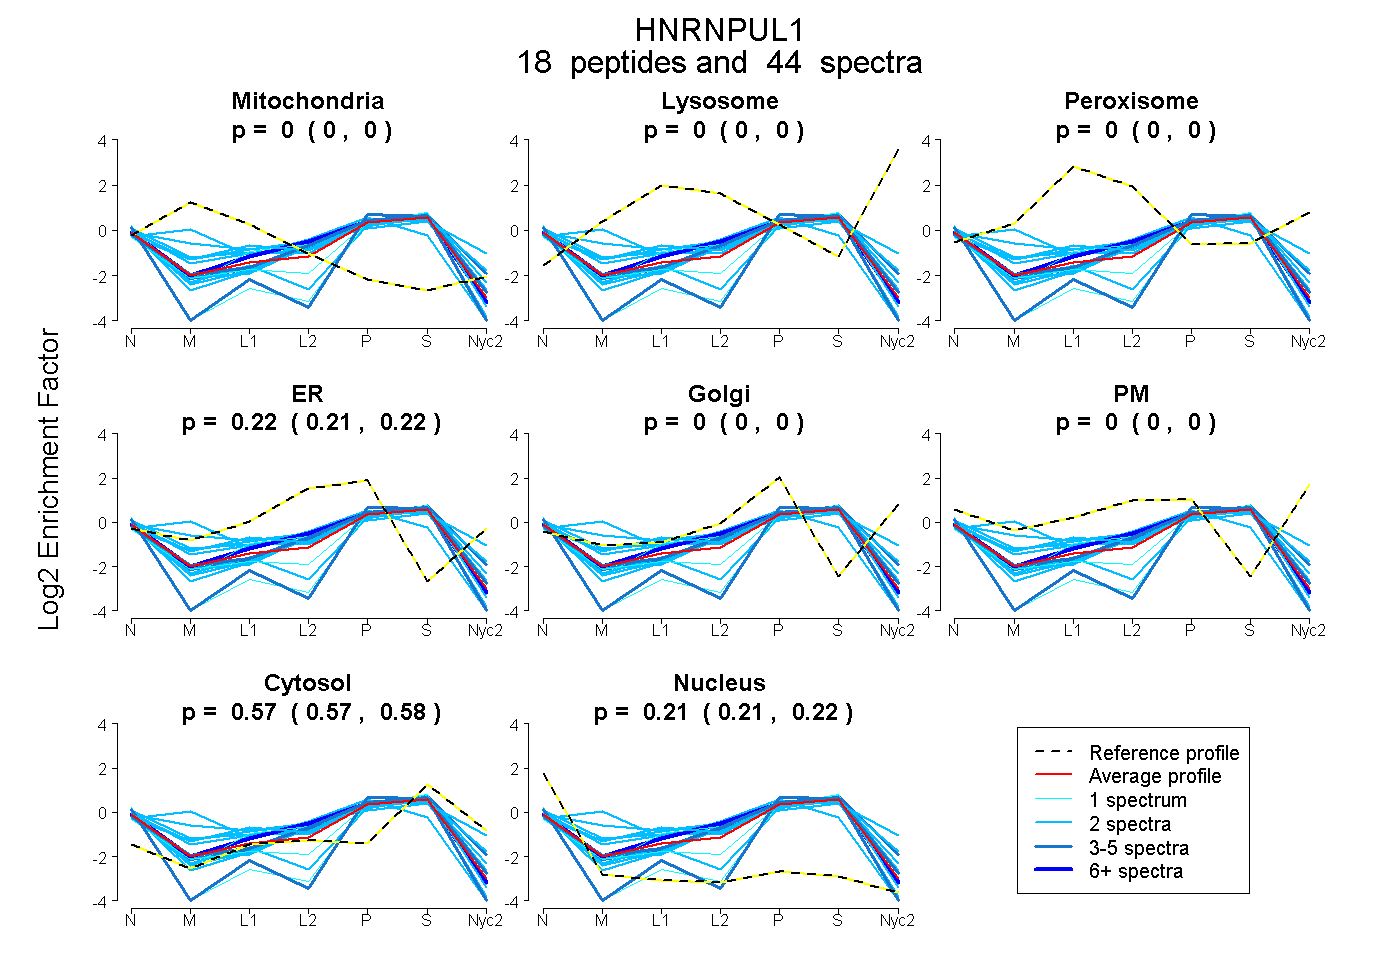
0.000 | 0.000
0.000 | 0.000
0.000 | 0.000
0.209 | 0.222
0.000 | 0.000
0.000 | 0.000
0.567 | 0.576
0.206 | 0.217
4peptides
spectra
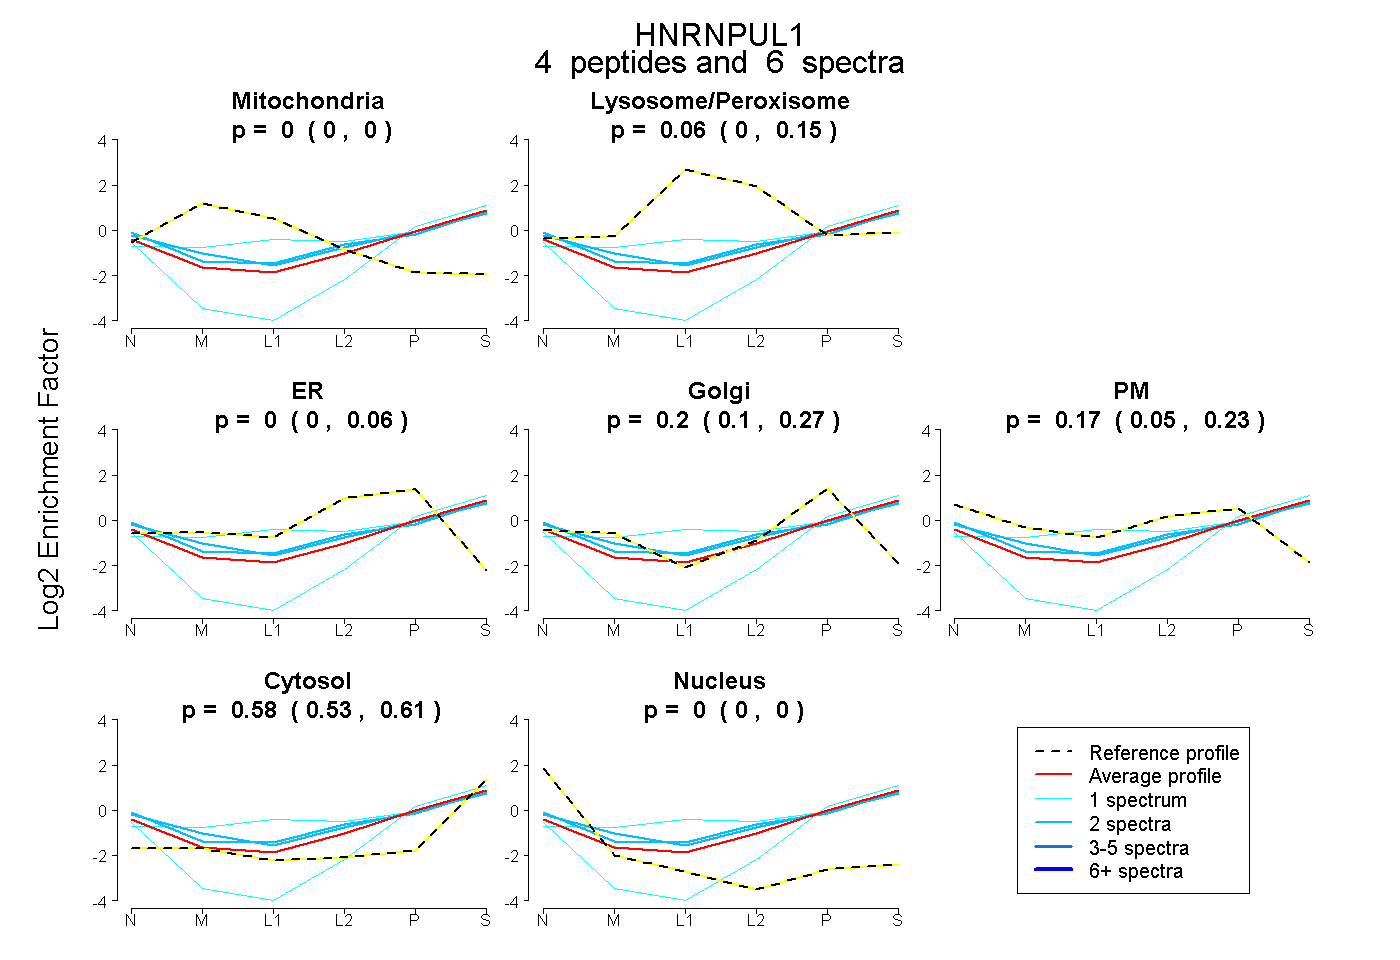
0.000 | 0.000
0.000 | 0.150
0.000 | 0.057
0.103 | 0.268
0.048 | 0.232
0.532 | 0.615
0.000 | 0.000