 18
18peptides
spectra
0.000 | 0.000
0.000 | 0.000
0.000 | 0.000
0.209 | 0.222
0.000 | 0.000
0.000 | 0.000
0.567 | 0.576
0.206 | 0.217
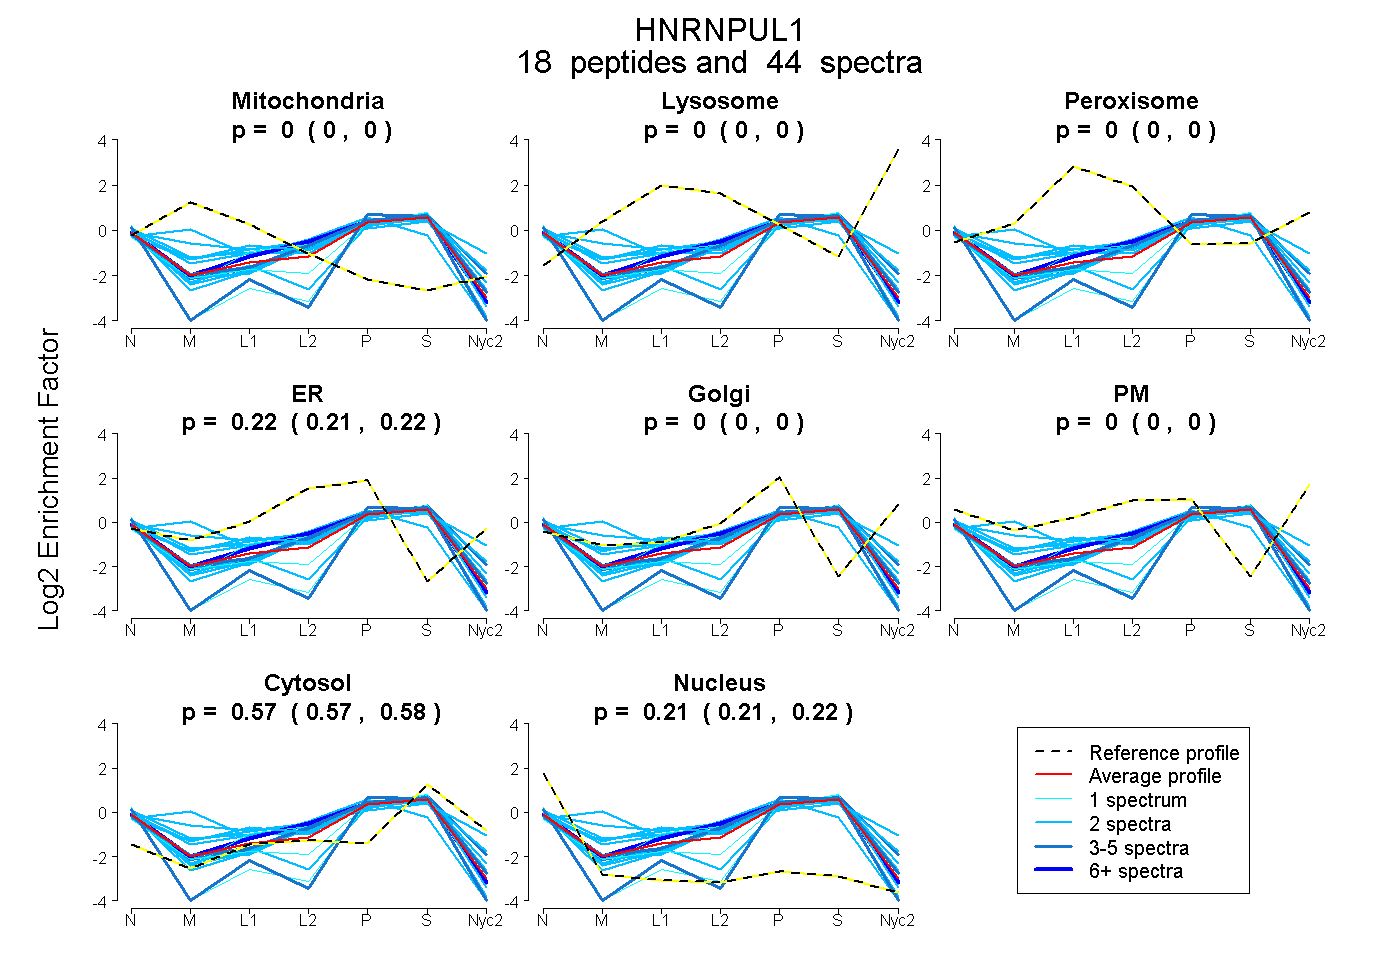
| Plot | Mito | Lyso | Perox | ER | Golgi | PM | Cytosol | Nucleus | |||||
| Expt A |
18 peptides |
44 spectra |
|
0.000 0.000 | 0.000 |
0.000 0.000 | 0.000 |
0.000 0.000 | 0.000 |
0.216 0.209 | 0.222 |
0.000 0.000 | 0.000 |
0.000 0.000 | 0.000 |
0.572 0.567 | 0.576 |
0.212 0.206 | 0.217 |
| 1 spectrum, QNQFYETPVIK | 0.000 | 0.000 | 0.000 | 0.000 | 0.000 | 0.000 | 0.536 | 0.464 | ||
| 2 spectra, NCAVEFNFGQR | 0.000 | 0.000 | 0.000 | 0.184 | 0.000 | 0.000 | 0.587 | 0.229 | ||
| 3 spectra, FENYGDK | 0.000 | 0.000 | 0.000 | 0.246 | 0.000 | 0.000 | 0.646 | 0.108 | ||
| 4 spectra, SGGGGYNQNR | 0.000 | 0.000 | 0.000 | 0.000 | 0.000 | 0.000 | 0.548 | 0.452 | ||
| 2 spectra, HLPSTEPDPHVVR | 0.298 | 0.000 | 0.000 | 0.278 | 0.000 | 0.000 | 0.290 | 0.134 | ||
| 2 spectra, LIQIAAR | 0.000 | 0.000 | 0.000 | 0.241 | 0.000 | 0.000 | 0.600 | 0.160 | ||
| 2 spectra, GTIGPK | 0.030 | 0.000 | 0.000 | 0.271 | 0.000 | 0.000 | 0.530 | 0.168 | ||
| 1 spectrum, RPLDMEPPQQAYRPELK | 0.000 | 0.000 | 0.000 | 0.092 | 0.000 | 0.000 | 0.602 | 0.306 | ||
| 2 spectra, QYNEEGR | 0.000 | 0.000 | 0.000 | 0.202 | 0.000 | 0.000 | 0.614 | 0.184 | ||
| 2 spectra, EALGGQALYPHVLVK | 0.000 | 0.000 | 0.000 | 0.214 | 0.000 | 0.000 | 0.604 | 0.182 | ||
| 2 spectra, INEEISVK | 0.089 | 0.000 | 0.000 | 0.252 | 0.000 | 0.000 | 0.584 | 0.075 | ||
| 1 spectrum, NYILDQTNVYGSAQR | 0.000 | 0.000 | 0.000 | 0.210 | 0.000 | 0.000 | 0.563 | 0.227 | ||
| 2 spectra, QENESVYDR | 0.000 | 0.000 | 0.000 | 0.058 | 0.000 | 0.000 | 0.562 | 0.380 | ||
| 2 spectra, AECEILMMVGLPAAGK | 0.066 | 0.000 | 0.000 | 0.275 | 0.000 | 0.000 | 0.502 | 0.157 | ||
| 2 spectra, YNILGTNAIMDK | 0.069 | 0.000 | 0.000 | 0.288 | 0.000 | 0.000 | 0.586 | 0.057 | ||
| 2 spectra, HAASNPSK | 0.145 | 0.000 | 0.035 | 0.215 | 0.034 | 0.041 | 0.529 | 0.000 | ||
| 3 spectra, WMGIAFR | 0.000 | 0.000 | 0.000 | 0.247 | 0.000 | 0.000 | 0.591 | 0.162 | ||
| 9 spectra, MRPFEGFQR | 0.000 | 0.000 | 0.000 | 0.272 | 0.000 | 0.000 | 0.557 | 0.171 |
| Plot | Mito | Lyso or Perox | ER | Golgi | PM | Cytosol | Nucleus | ||||||
| Expt B |
4 peptides |
6 spectra |
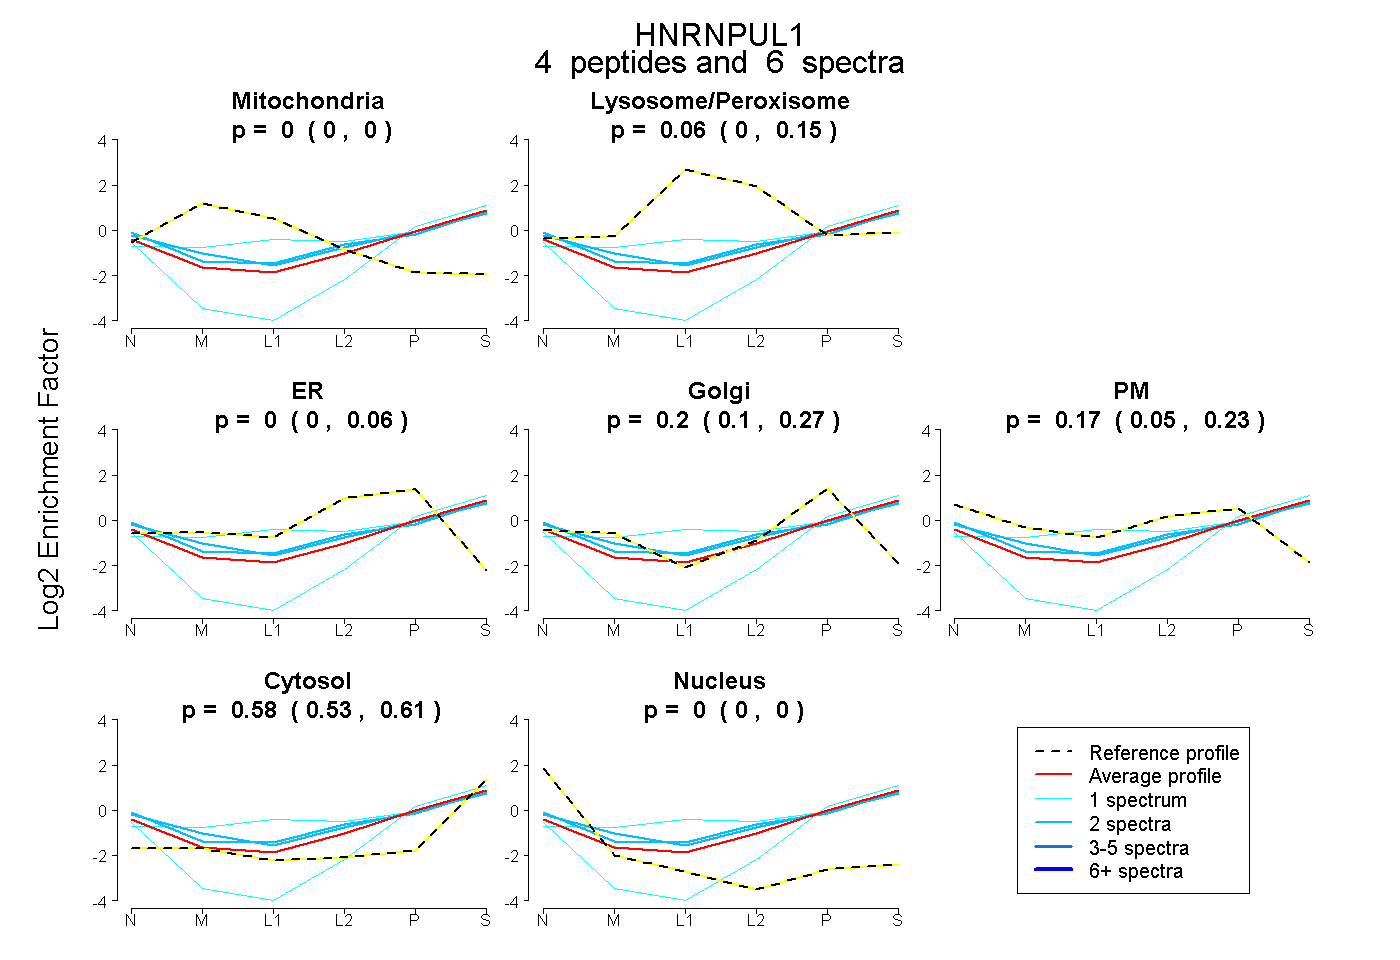 |
0.000 0.000 | 0.000 |
0.058 0.000 | 0.150 |
0.000 0.000 | 0.057 |
0.195 0.103 | 0.268 |
0.167 0.048 | 0.232 |
0.580 0.532 | 0.615 |
0.000 0.000 | 0.000 |
|||
| Plot | Lyso | Other | |||||||||||
| Expt C |
3 peptides |
5 spectra |
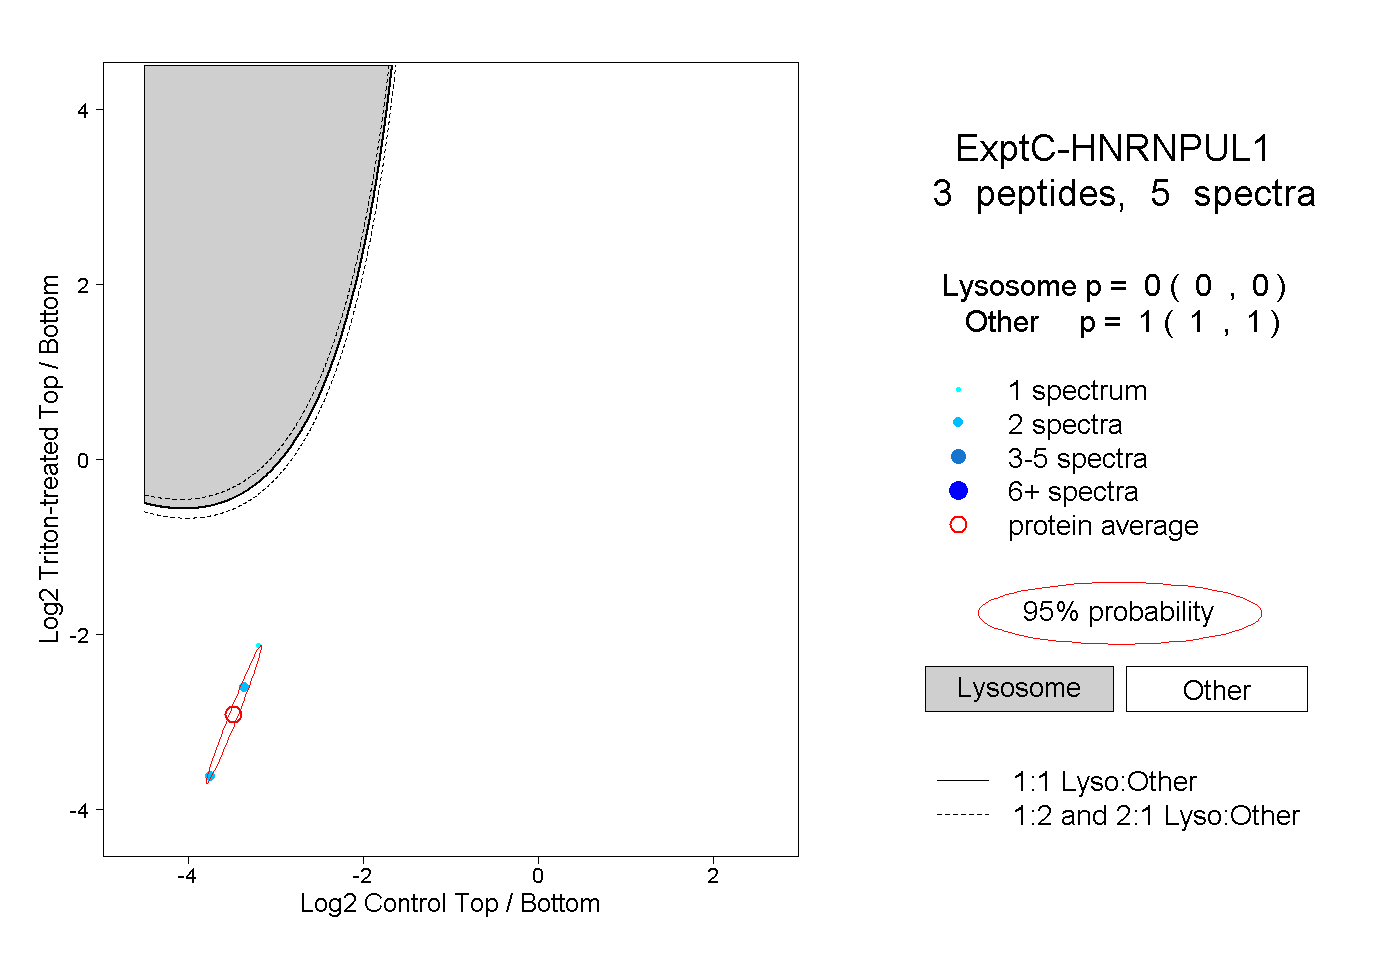 |
0.000 0.000 | 0.000 |
1.000 1.000 | 1.000 |