 2
2peptides
spectra
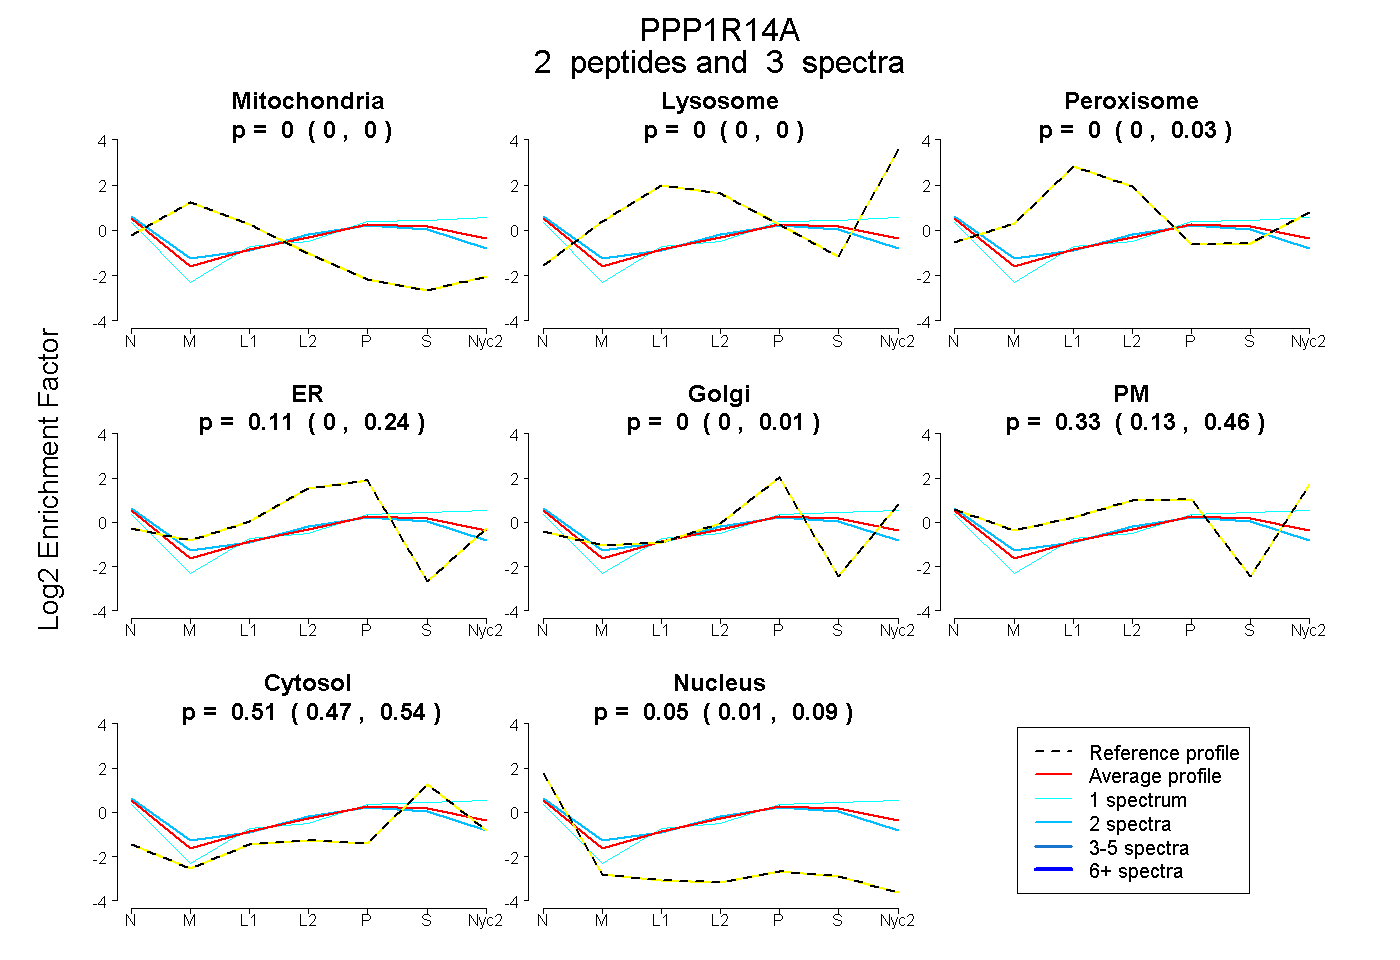
0.000 | 0.000
0.000 | 0.000
0.000 | 0.025
0.000 | 0.240
0.000 | 0.012
0.125 | 0.460
0.468 | 0.537
0.015 | 0.087
| Plot | Mito | Lyso | Perox | ER | Golgi | PM | Cytosol | Nucleus | |||||
| Expt A |
2 peptides |
3 spectra |
|
0.000 0.000 | 0.000 |
0.000 0.000 | 0.000 |
0.000 0.000 | 0.025 |
0.107 0.000 | 0.240 |
0.000 0.000 | 0.012 |
0.331 0.125 | 0.460 |
0.510 0.468 | 0.537 |
0.053 0.015 | 0.087 |
| 2 spectra, QDPAHTAPP | 0.000 | 0.000 | 0.039 | 0.218 | 0.000 | 0.199 | 0.439 | 0.104 | ||
| 1 spectrum, GPGGSPSGLQK | 0.000 | 0.000 | 0.000 | 0.000 | 0.028 | 0.395 | 0.577 | 0.000 |
| Plot | Lyso | Other | |||||||||||
| Expt C |
1 peptide |
3 spectra |
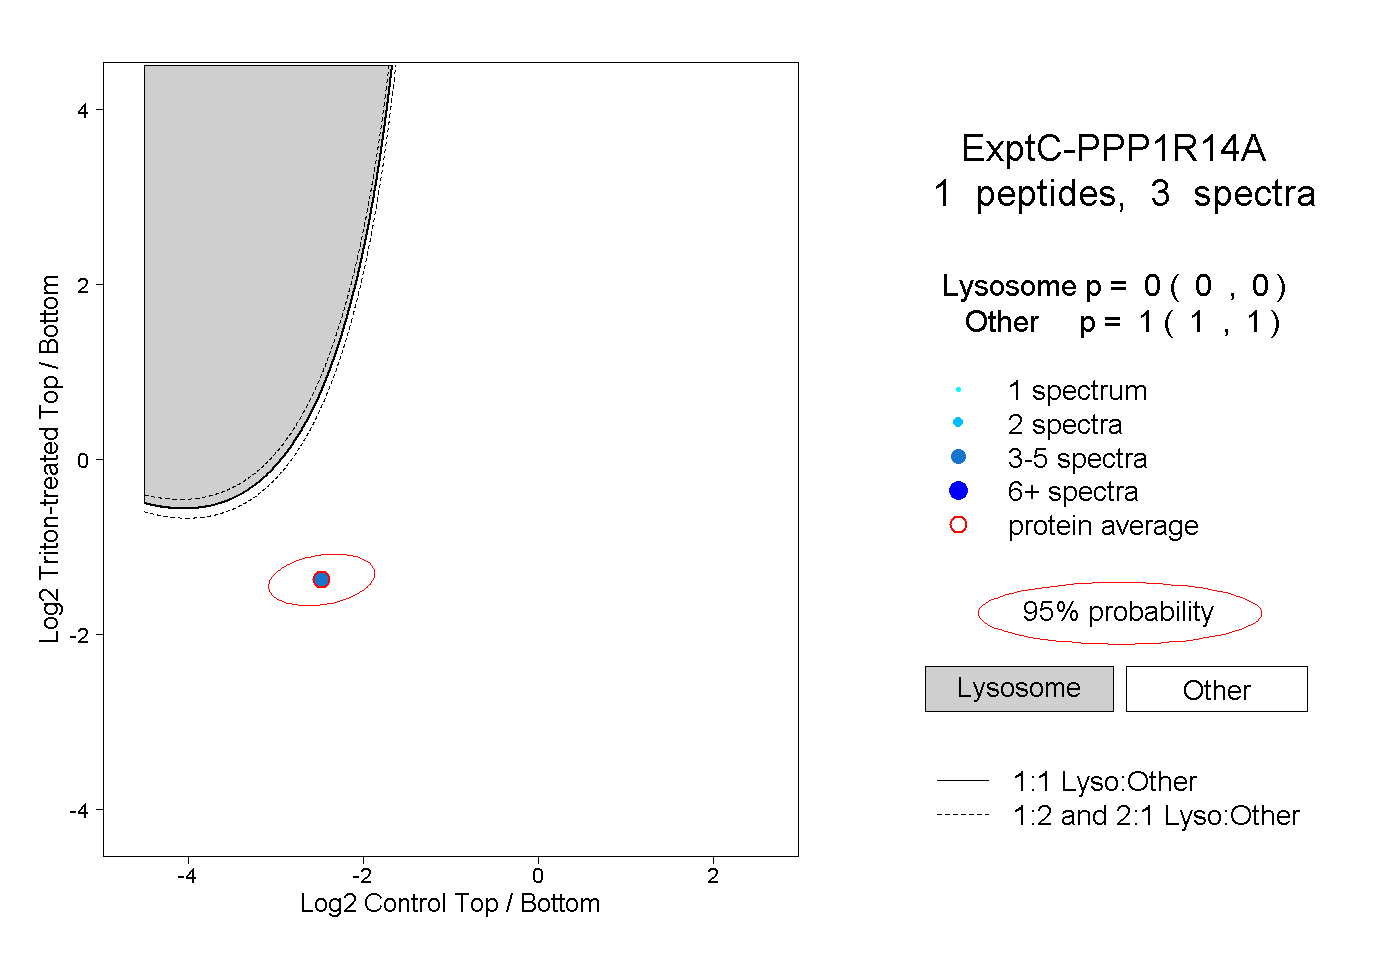 |
0.000 0.000 | 0.000 |
1.000 1.000 | 1.000 |