 5
5peptides
spectra
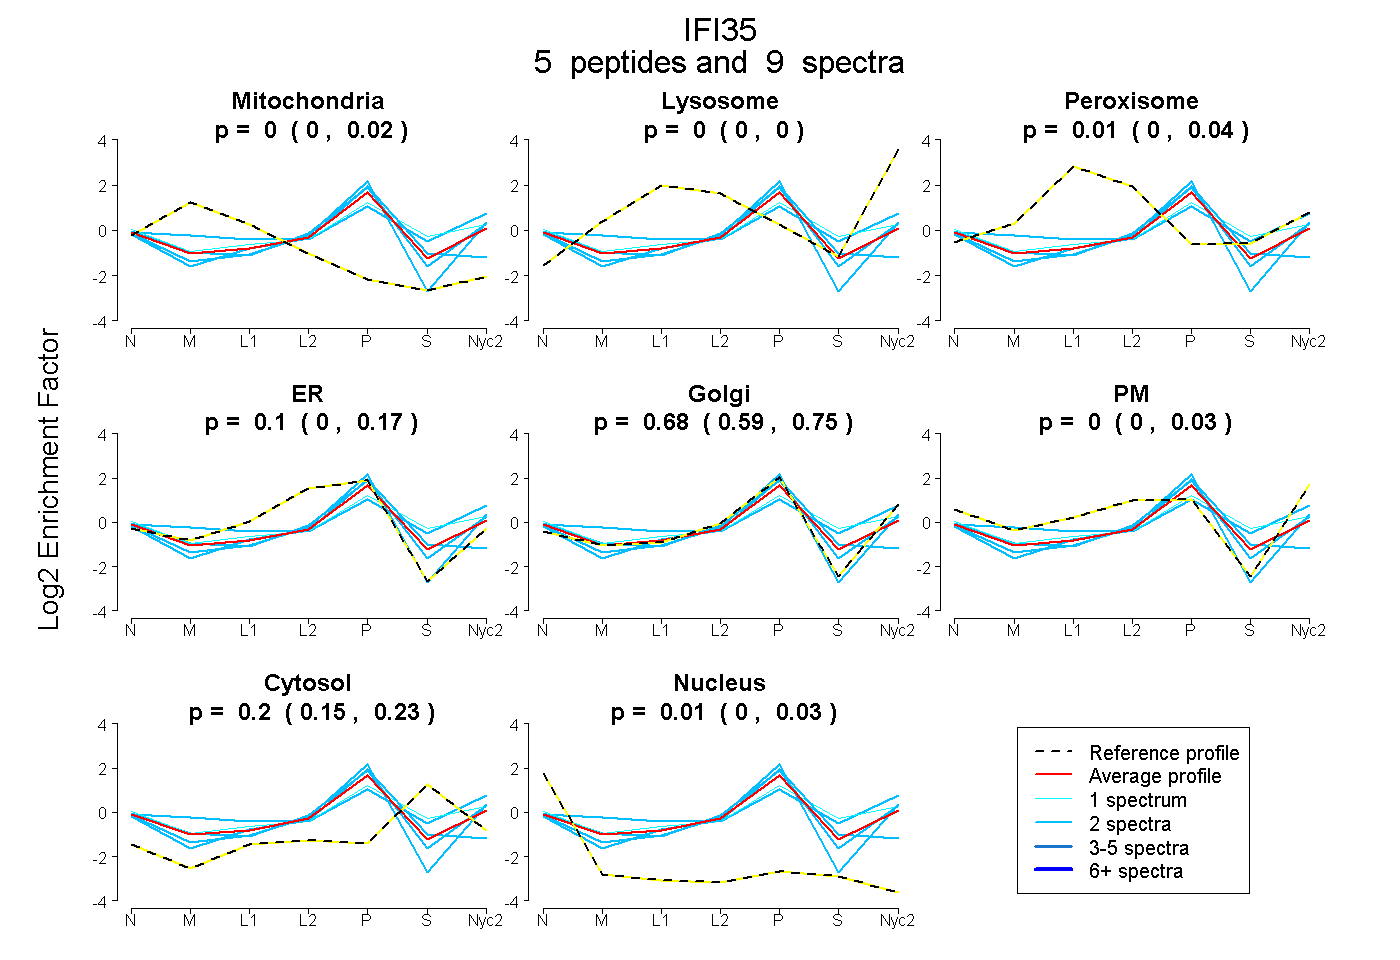
0.000 | 0.022
0.000 | 0.000
0.000 | 0.044
0.000 | 0.168
0.585 | 0.748
0.000 | 0.029
0.146 | 0.235
0.000 | 0.030
1peptide
spectrum
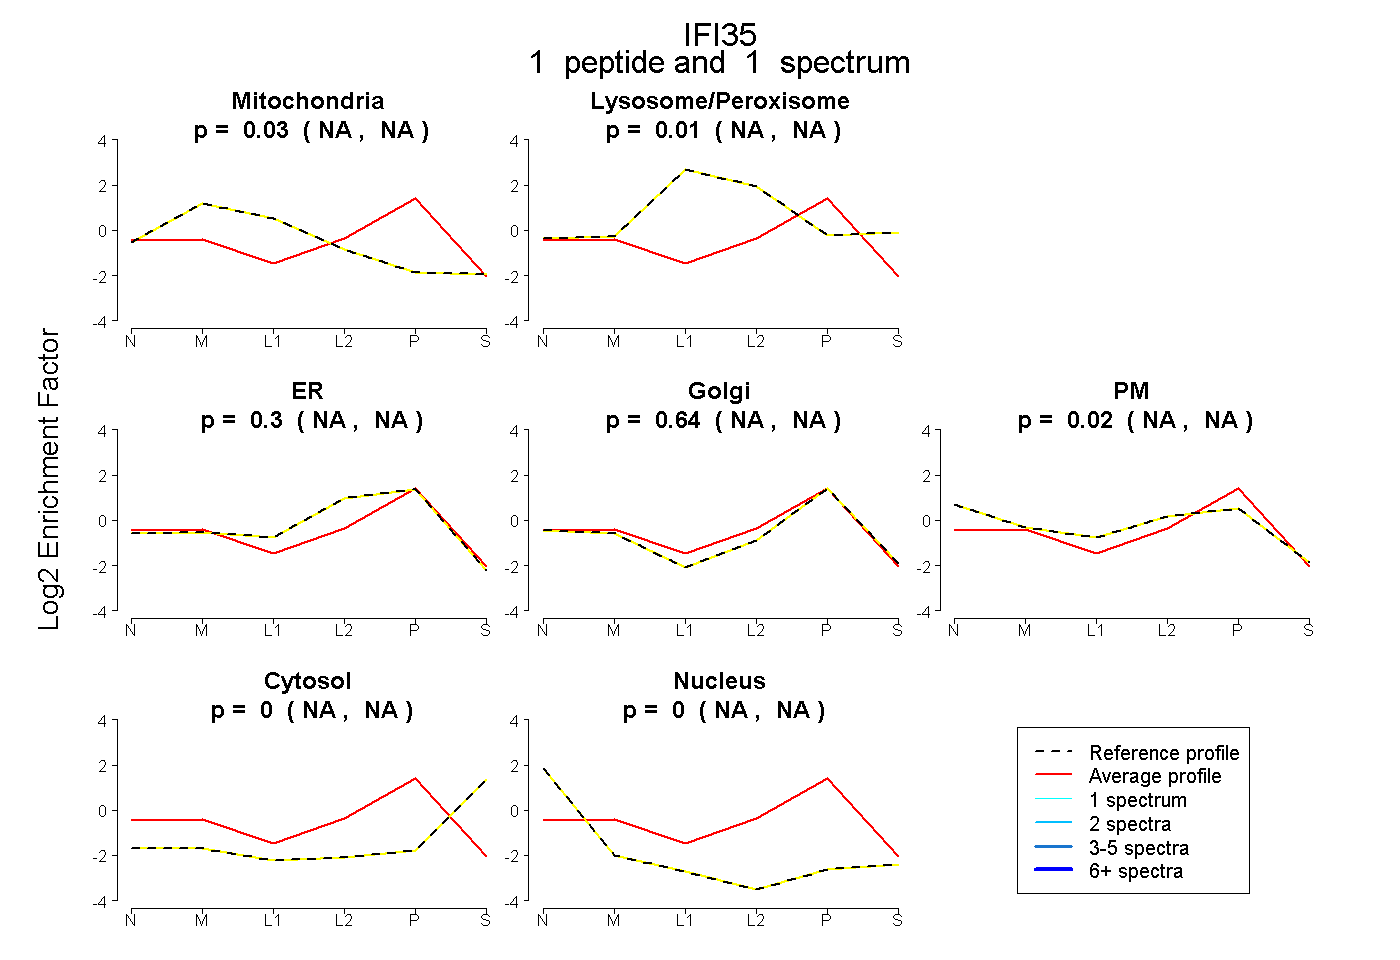
NA | NA
NA | NA
NA | NA
NA | NA
NA | NA
NA | NA
NA | NA
3peptides
spectra
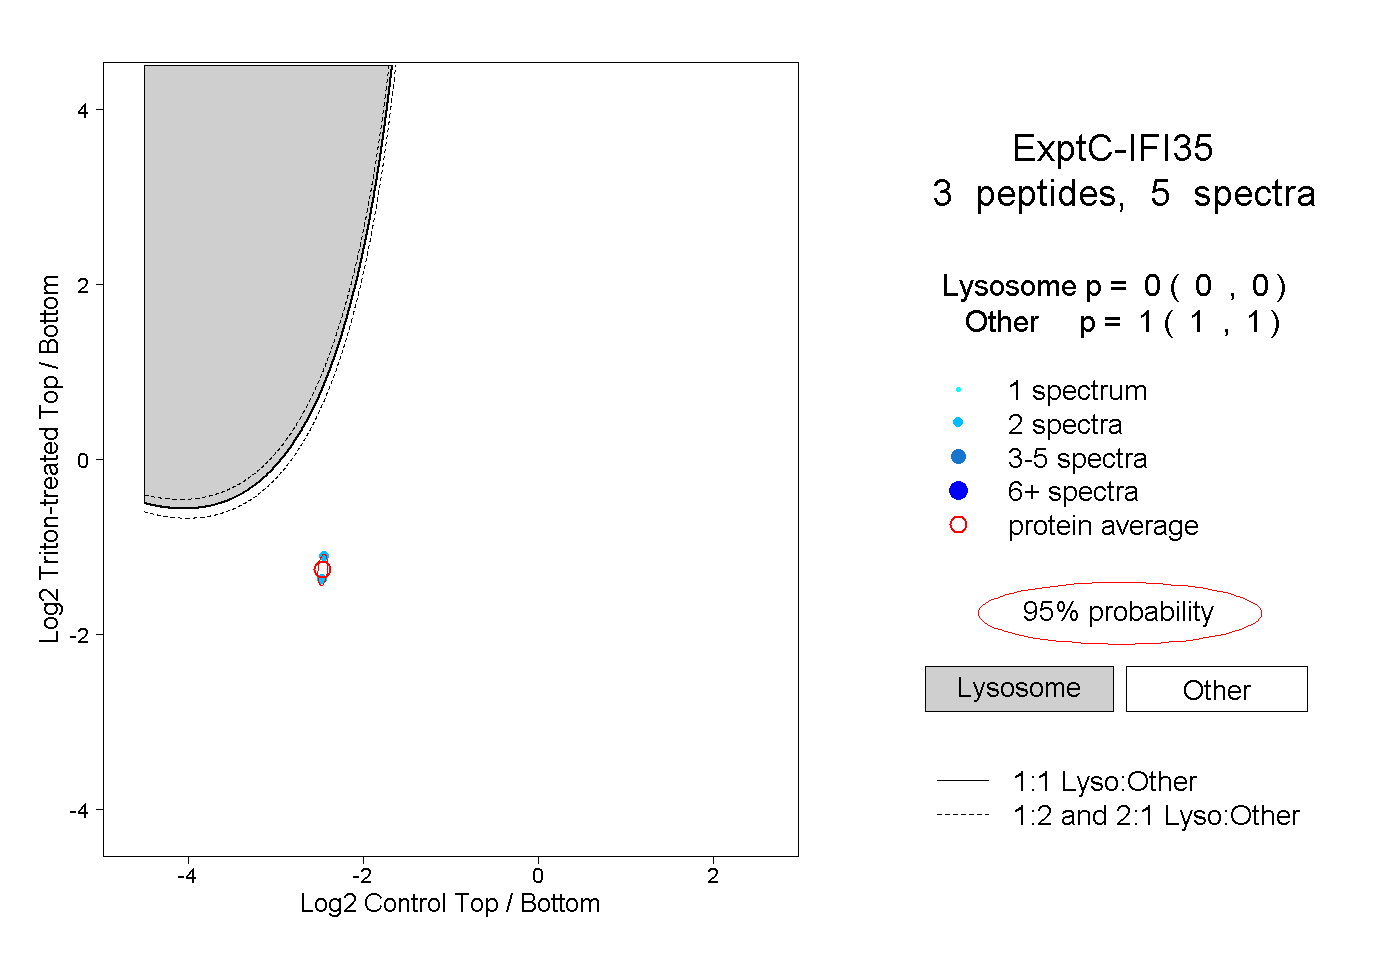
0.000 | 0.000
1.000 | 1.000