14
14peptides
spectra
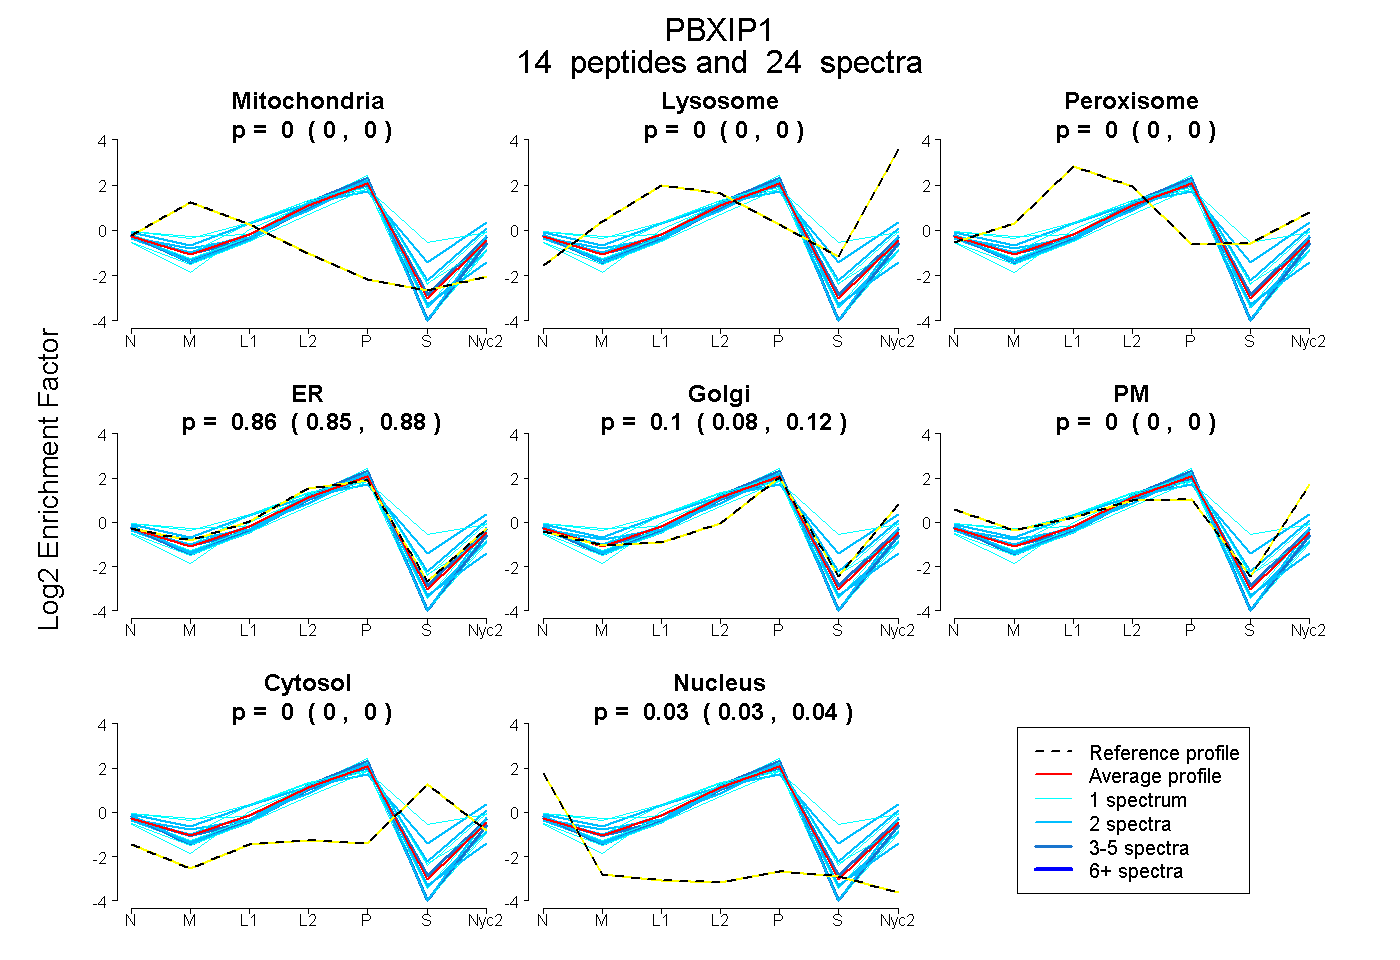
0.000 | 0.000
0.000 | 0.000
0.000 | 0.000
0.846 | 0.876
0.083 | 0.119
0.000 | 0.000
0.000 | 0.000
0.030 | 0.039
3peptides
spectra
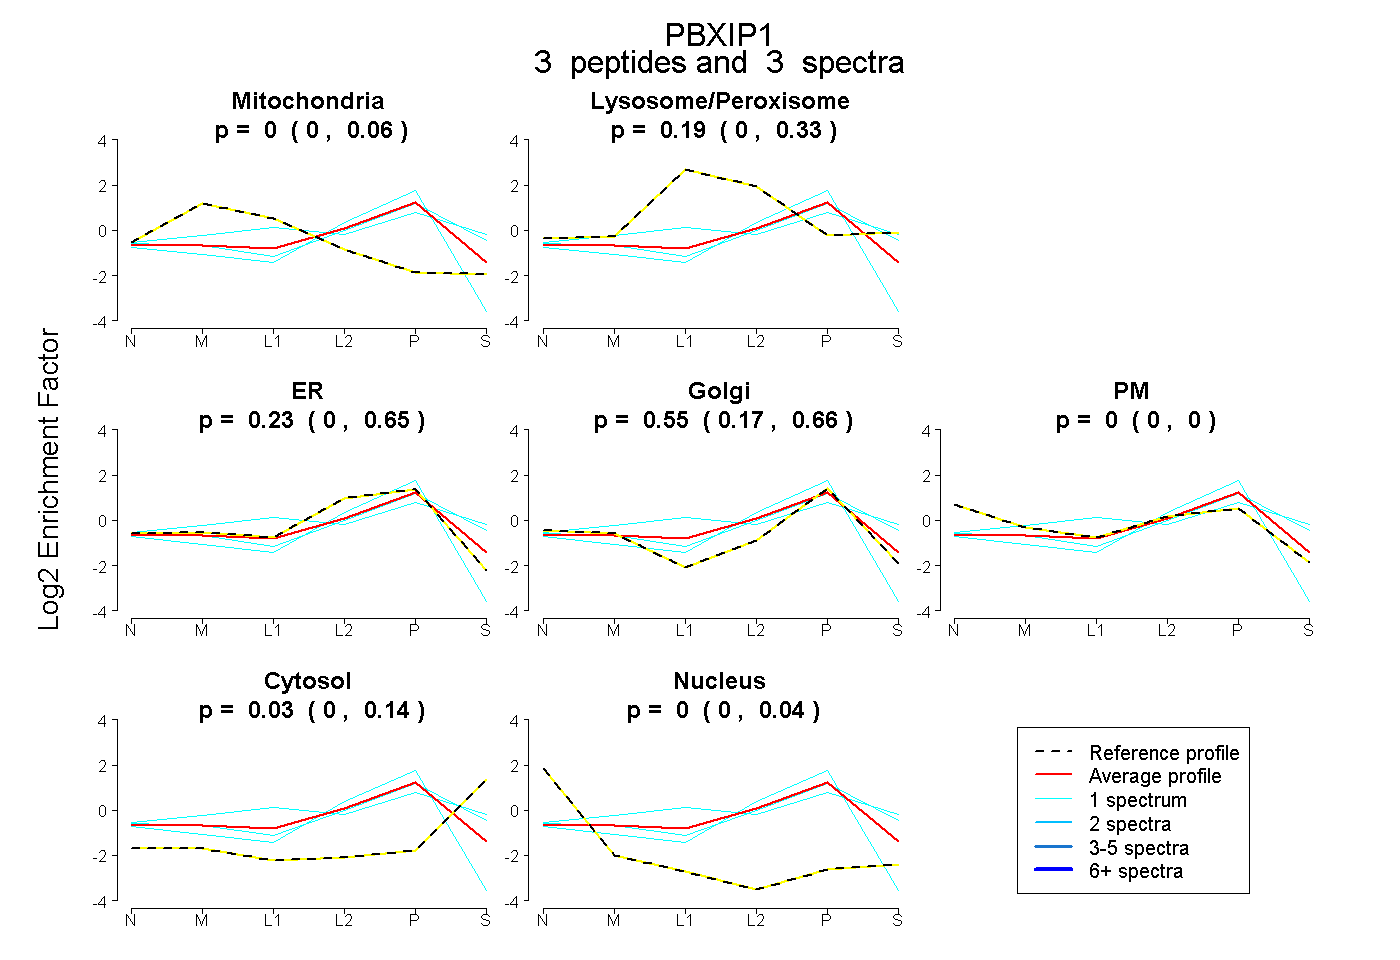
0.000 | 0.061
0.000 | 0.332
0.000 | 0.651
0.166 | 0.657
0.000 | 0.000
0.000 | 0.143
0.000 | 0.036
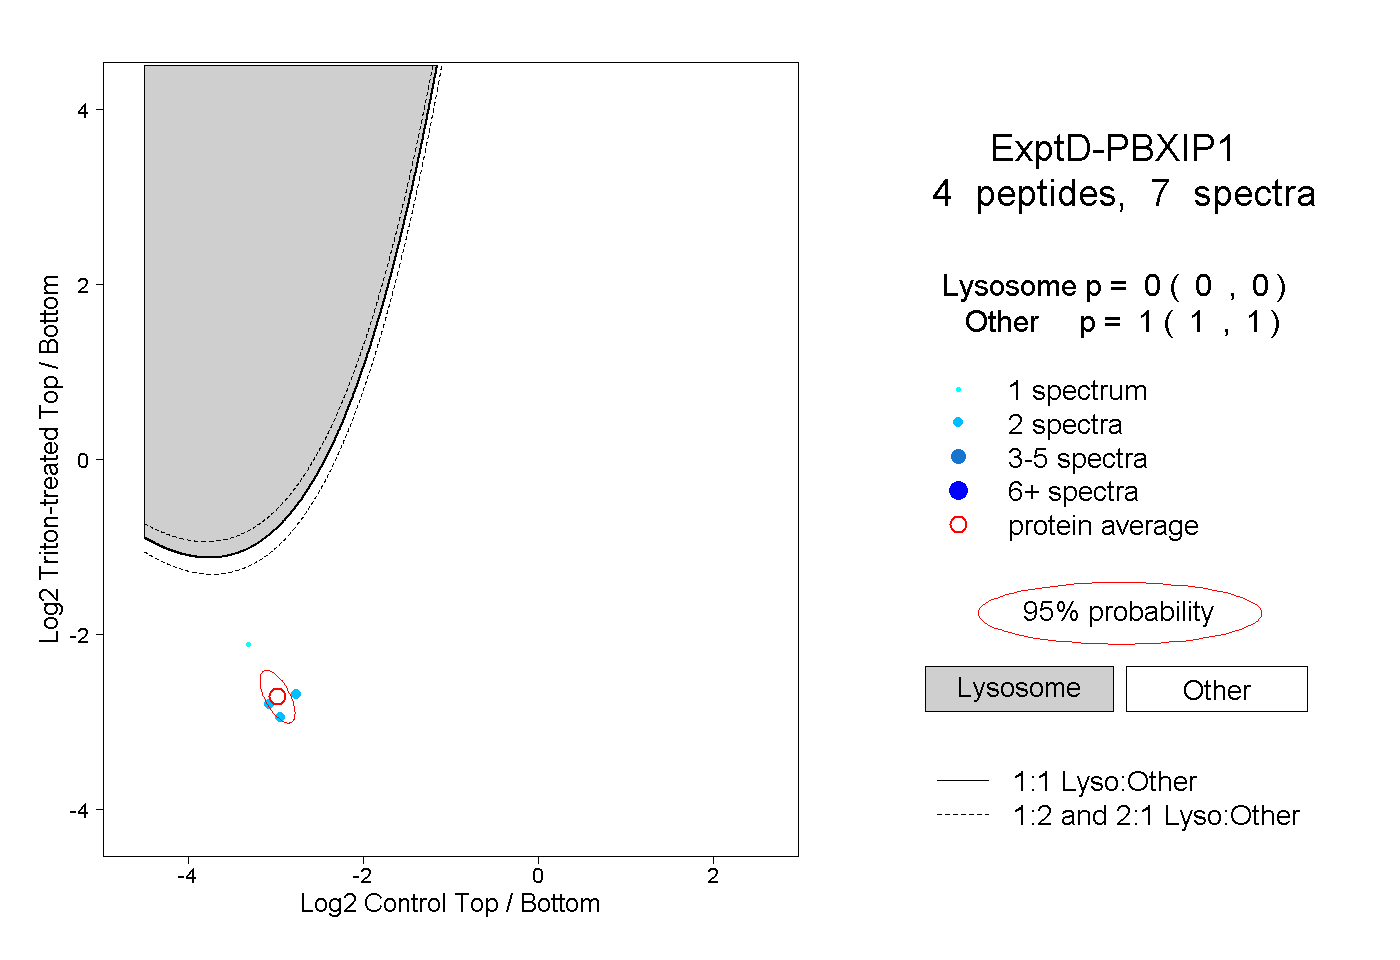
10peptides
spectra
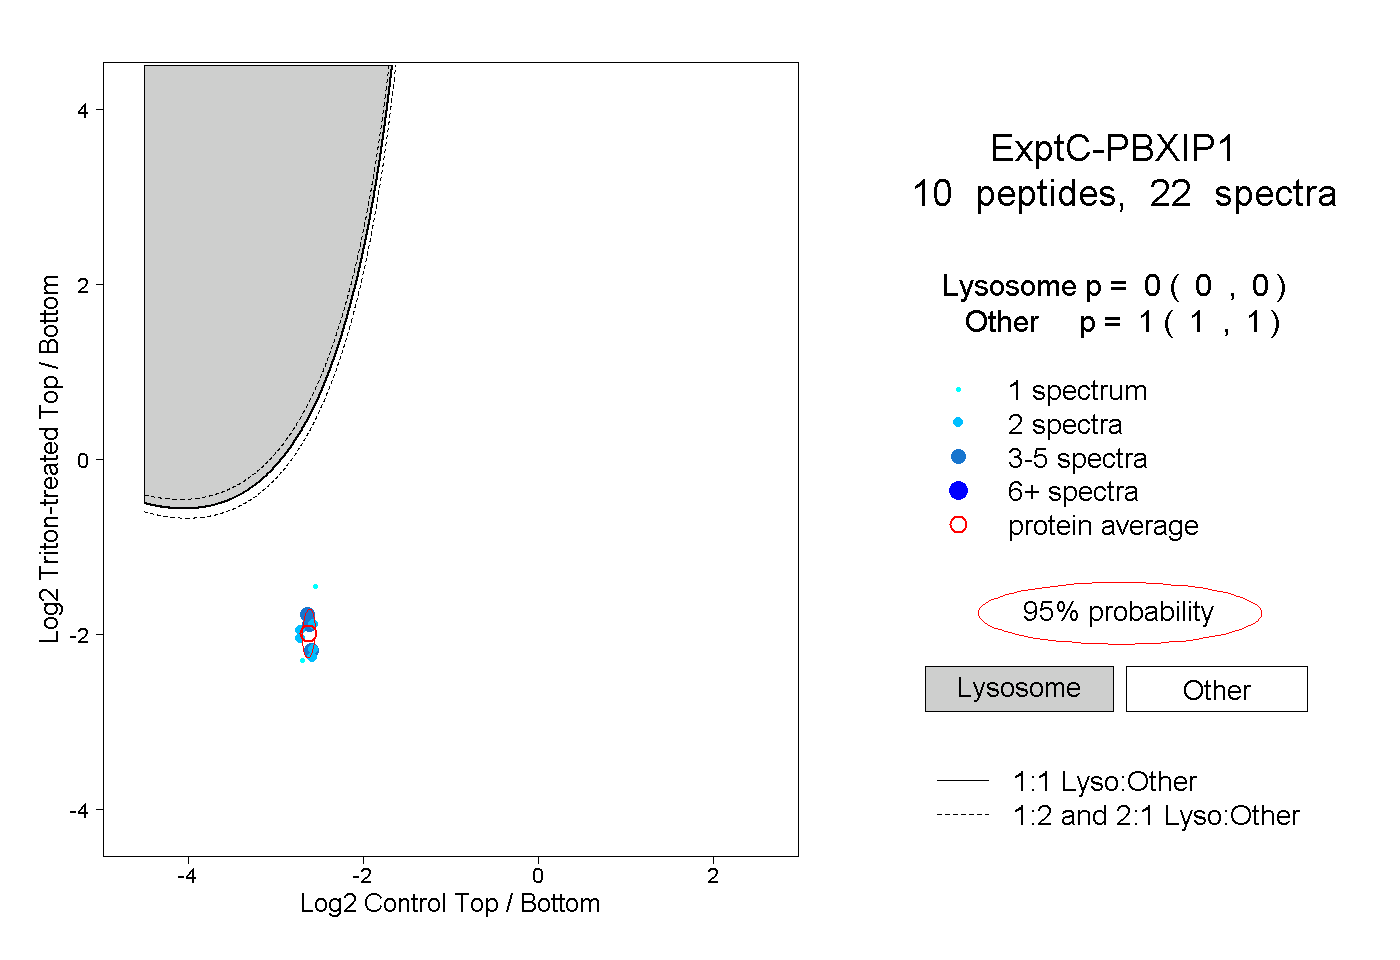
0.000 | 0.000
1.000 | 1.000