18
18peptides
spectra
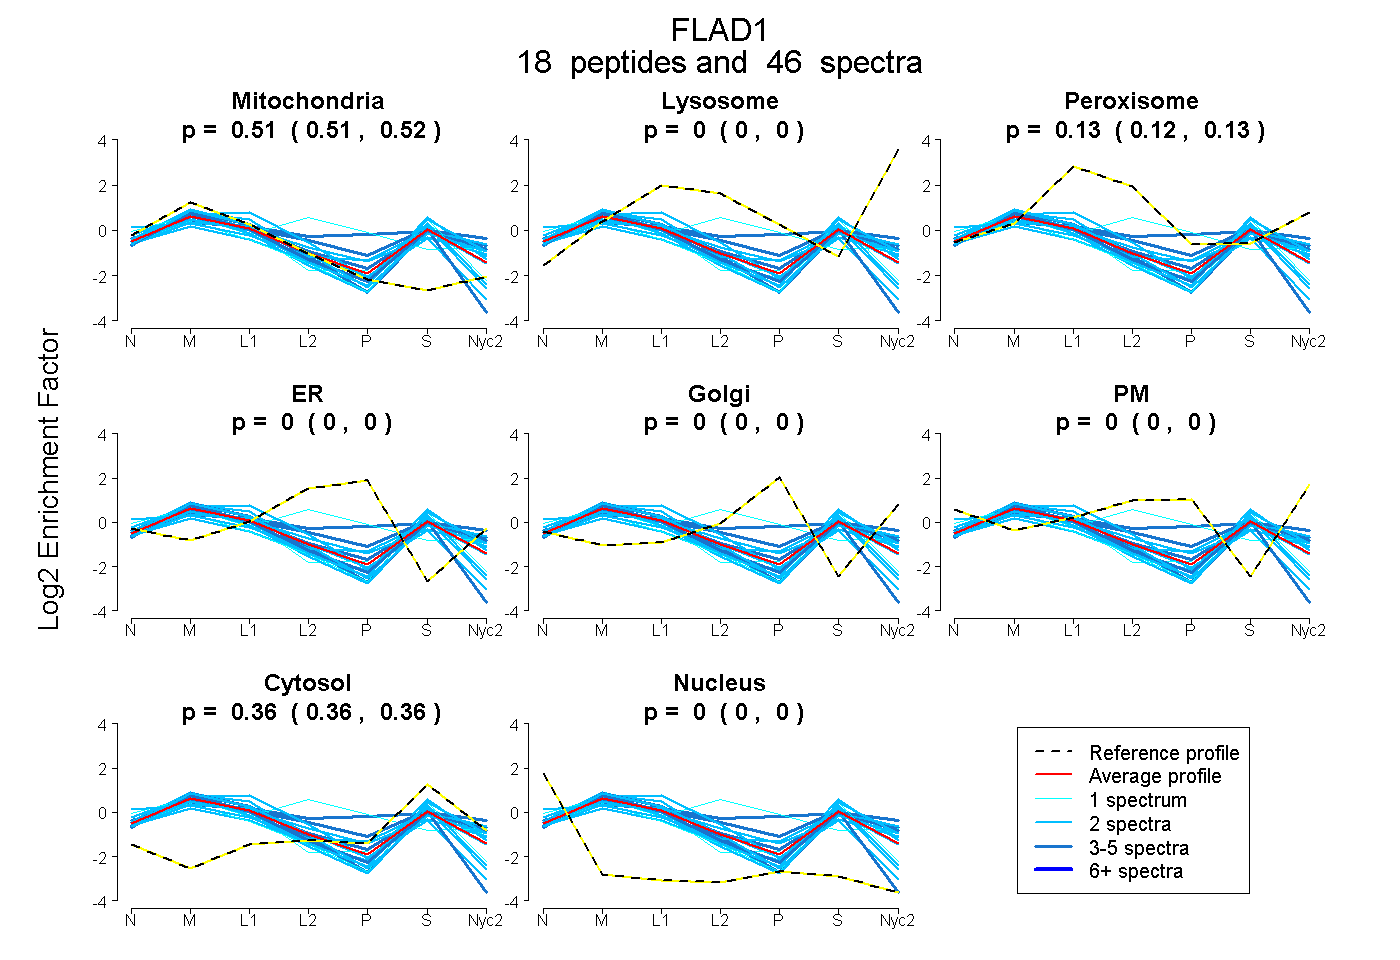
0.506 | 0.521
0.000 | 0.000
0.118 | 0.131
0.000 | 0.000
0.000 | 0.000
0.000 | 0.000
0.357 | 0.363
0.000 | 0.000
6peptides
spectra
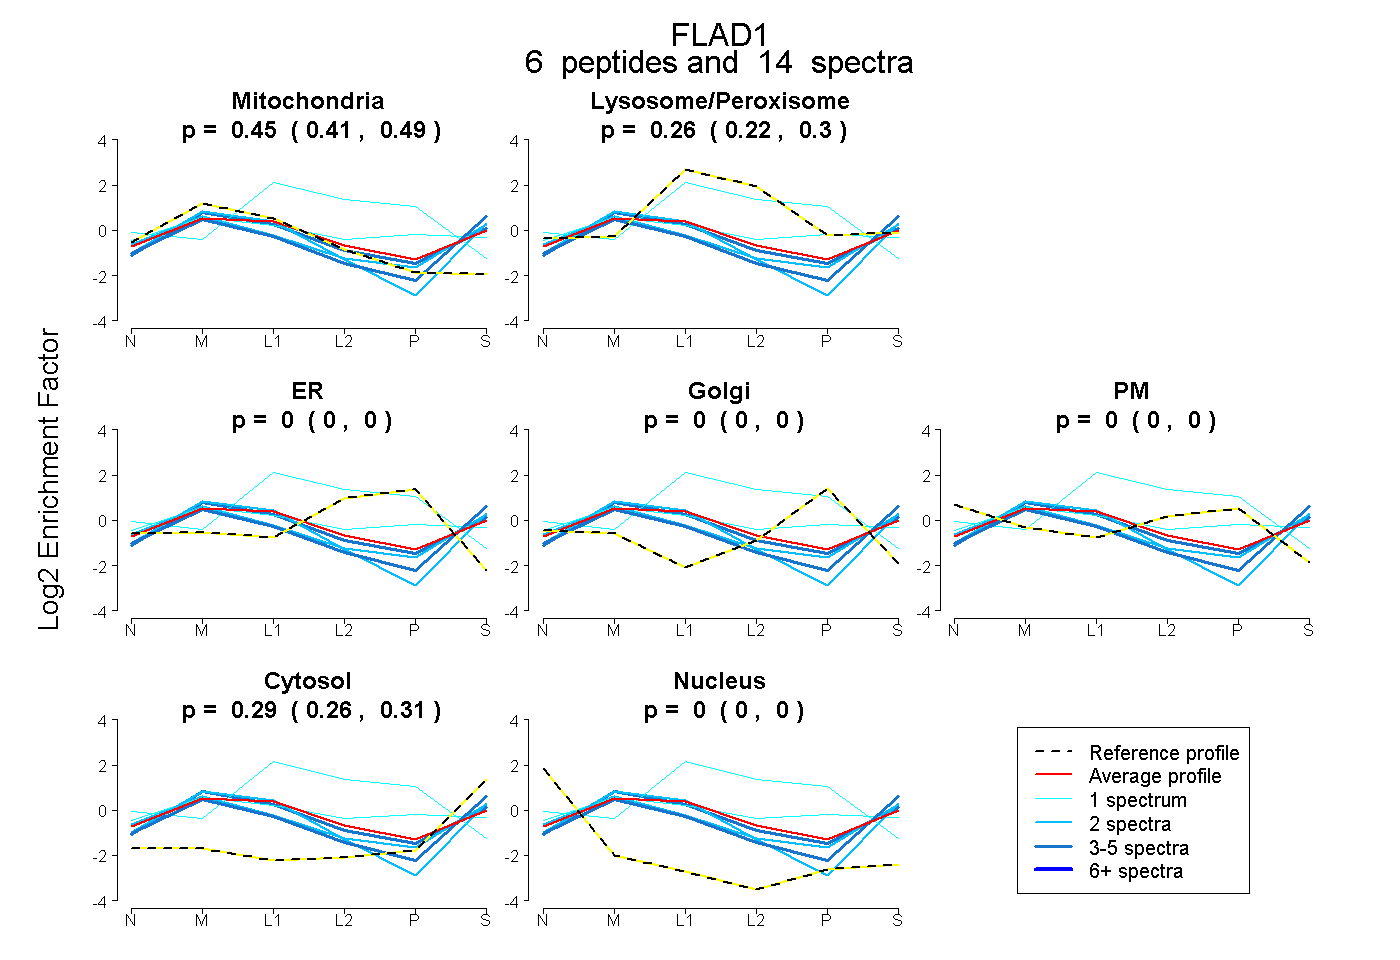
0.411 | 0.490
0.215 | 0.295
0.000 | 0.000
0.000 | 0.003
0.000 | 0.000
0.259 | 0.309
0.000 | 0.000