14
14peptides
spectra
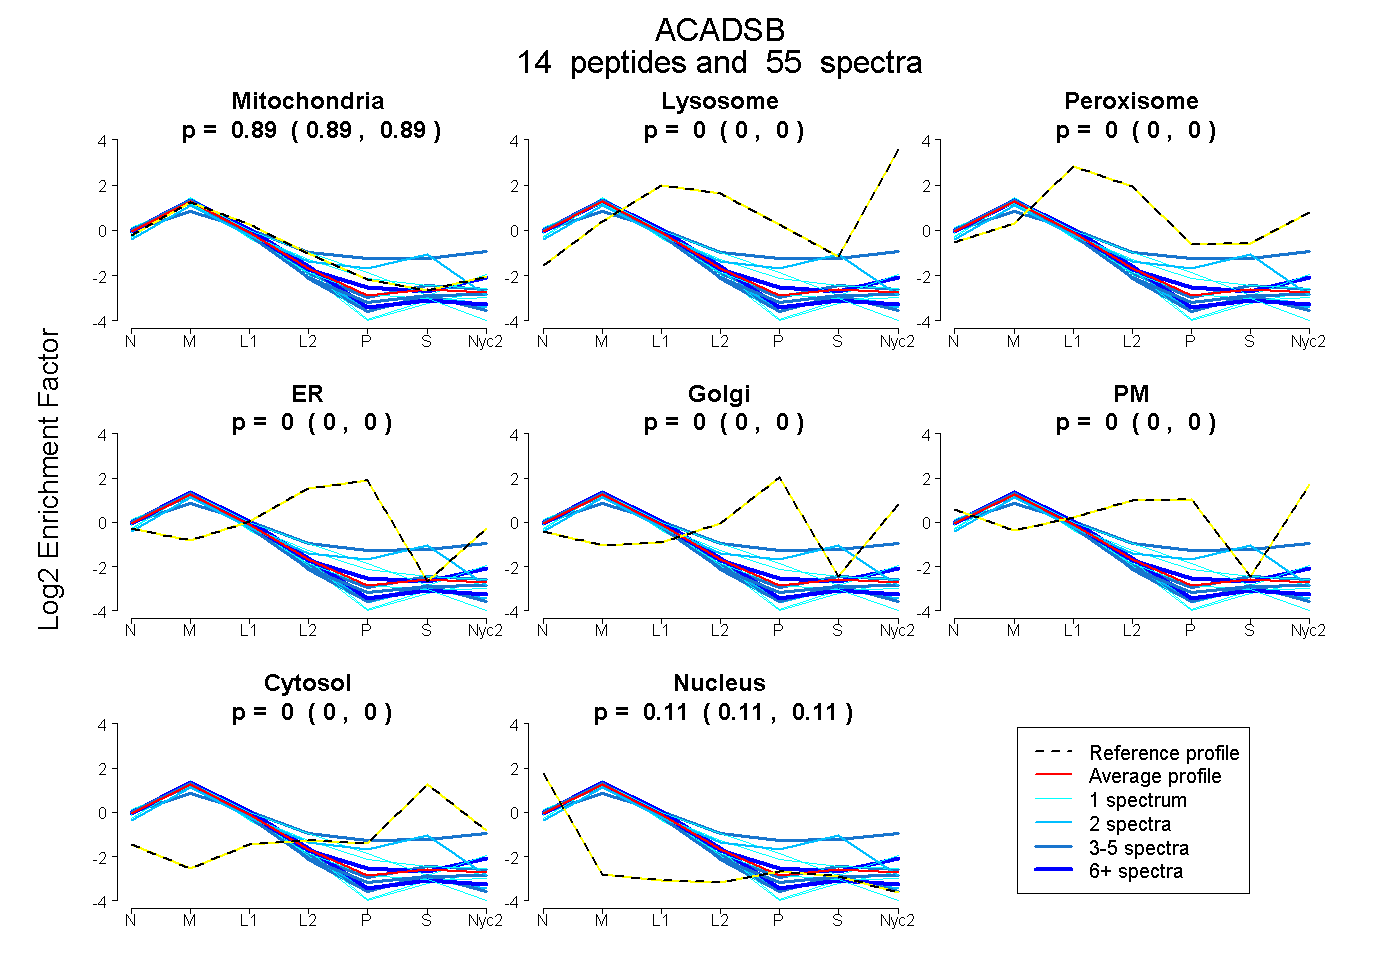
0.887 | 0.893
0.000 | 0.000
0.000 | 0.000
0.000 | 0.000
0.000 | 0.000
0.000 | 0.000
0.000 | 0.000
0.107 | 0.113
9peptides
spectra
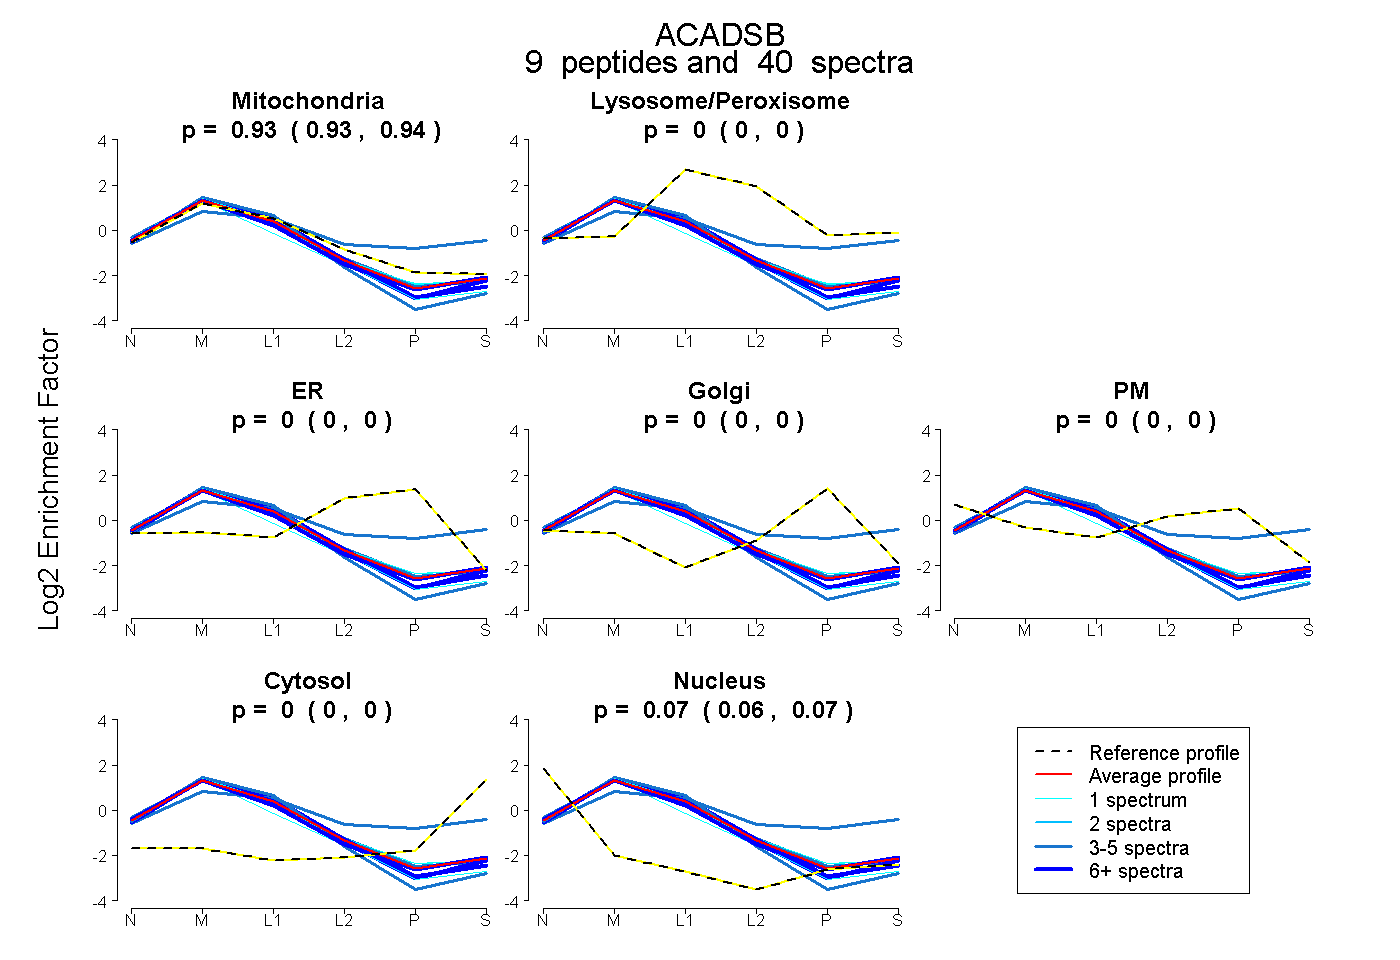
0.929 | 0.937
0.000 | 0.000
0.000 | 0.000
0.000 | 0.000
0.000 | 0.000
0.000 | 0.000
0.062 | 0.070