 14
14peptides
spectra
0.887 | 0.893
0.000 | 0.000
0.000 | 0.000
0.000 | 0.000
0.000 | 0.000
0.000 | 0.000
0.000 | 0.000
0.107 | 0.113
| Plot | Mito | Lyso | Perox | ER | Golgi | PM | Cytosol | Nucleus | |||||
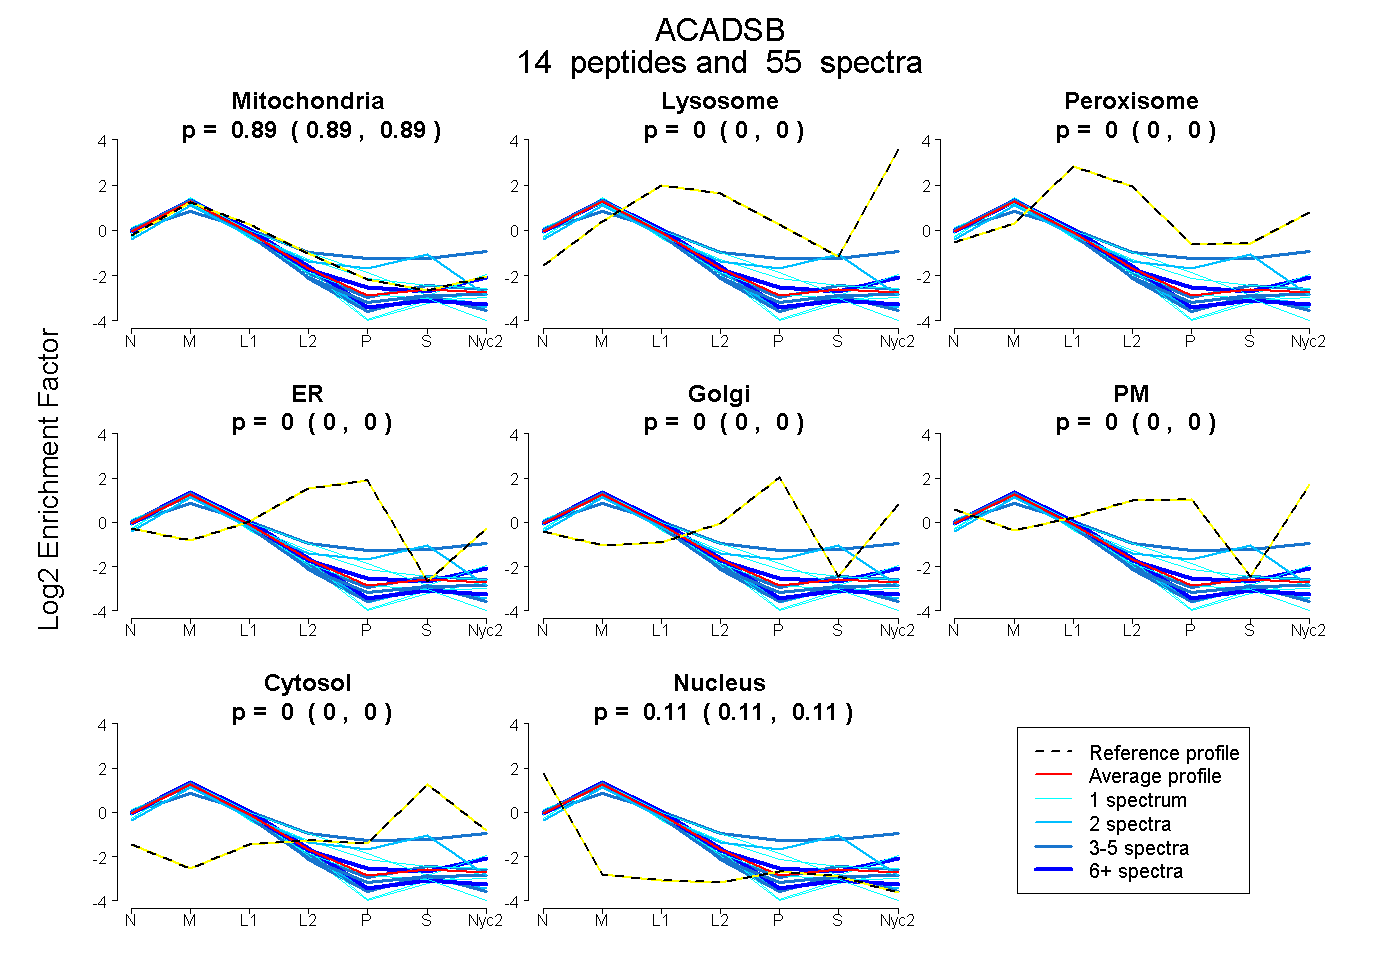
| Expt A |
14 peptides |
55 spectra |
|
0.890 0.887 | 0.893 |
0.000 0.000 | 0.000 |
0.000 0.000 | 0.000 |
0.000 0.000 | 0.000 |
0.000 0.000 | 0.000 |
0.000 0.000 | 0.000 |
0.000 0.000 | 0.000 |
0.110 0.107 | 0.113 |
| 17 spectra, LLTYNAAR | 0.920 | 0.000 | 0.000 | 0.000 | 0.000 | 0.000 | 0.000 | 0.080 | ||
| 2 spectra, ASSTCQLTFENVK | 0.874 | 0.000 | 0.000 | 0.000 | 0.000 | 0.000 | 0.000 | 0.126 | ||
| 2 spectra, ATYLPK | 0.836 | 0.000 | 0.000 | 0.000 | 0.000 | 0.000 | 0.000 | 0.164 | ||
| 8 spectra, LVEAGRPFIK | 0.876 | 0.000 | 0.000 | 0.000 | 0.000 | 0.000 | 0.000 | 0.124 | ||
| 1 spectrum, FAQEQIAPLVSTMDENSK | 0.889 | 0.000 | 0.000 | 0.000 | 0.000 | 0.000 | 0.000 | 0.111 | ||
| 4 spectra, GITCFLVDR | 0.835 | 0.000 | 0.000 | 0.000 | 0.000 | 0.000 | 0.000 | 0.165 | ||
| 1 spectrum, VDASVALLCDIQNTVINK | 0.950 | 0.000 | 0.000 | 0.000 | 0.050 | 0.000 | 0.000 | 0.000 | ||
| 5 spectra, DTEGFQIGR | 0.874 | 0.000 | 0.000 | 0.000 | 0.000 | 0.000 | 0.000 | 0.126 | ||
| 1 spectrum, IFDFQGLQHQVAHVATQLEAAR | 0.857 | 0.000 | 0.000 | 0.000 | 0.000 | 0.000 | 0.000 | 0.143 | ||
| 1 spectrum, SVIQGLFQQGMMGIEVEAK | 0.902 | 0.000 | 0.000 | 0.000 | 0.000 | 0.000 | 0.000 | 0.098 | ||
| 1 spectrum, VPETSVLGK | 0.817 | 0.000 | 0.000 | 0.000 | 0.000 | 0.000 | 0.000 | 0.183 | ||
| 5 spectra, YAIGSLNEGR | 0.848 | 0.000 | 0.000 | 0.000 | 0.000 | 0.000 | 0.000 | 0.152 | ||
| 2 spectra, YGGTEASFLCSVLVIEELAK | 0.796 | 0.000 | 0.000 | 0.000 | 0.000 | 0.000 | 0.200 | 0.005 | ||
| 5 spectra, IGHGYK | 0.622 | 0.036 | 0.031 | 0.000 | 0.000 | 0.127 | 0.185 | 0.000 |
| Plot | Mito | Lyso or Perox | ER | Golgi | PM | Cytosol | Nucleus | ||||||
| Expt B |
9 peptides |
40 spectra |
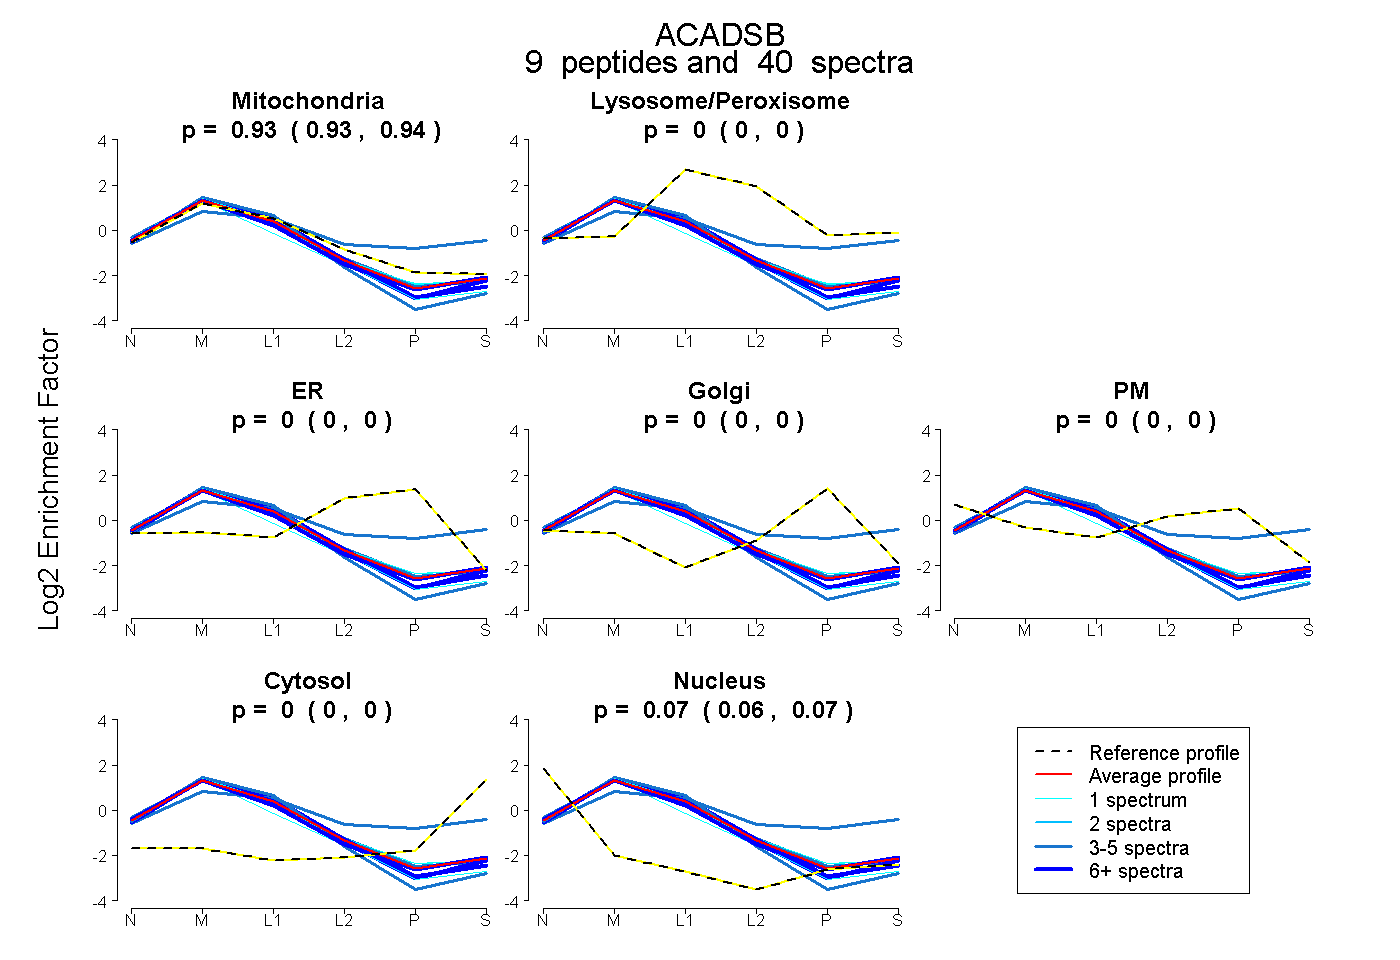 |
0.934 0.929 | 0.937 |
0.000 0.000 | 0.000 |
0.000 0.000 | 0.000 |
0.000 0.000 | 0.000 |
0.000 0.000 | 0.000 |
0.000 0.000 | 0.000 |
0.066 0.062 | 0.070 |
|||
| Plot | Lyso | Other | |||||||||||
| Expt C |
17 peptides |
266 spectra |
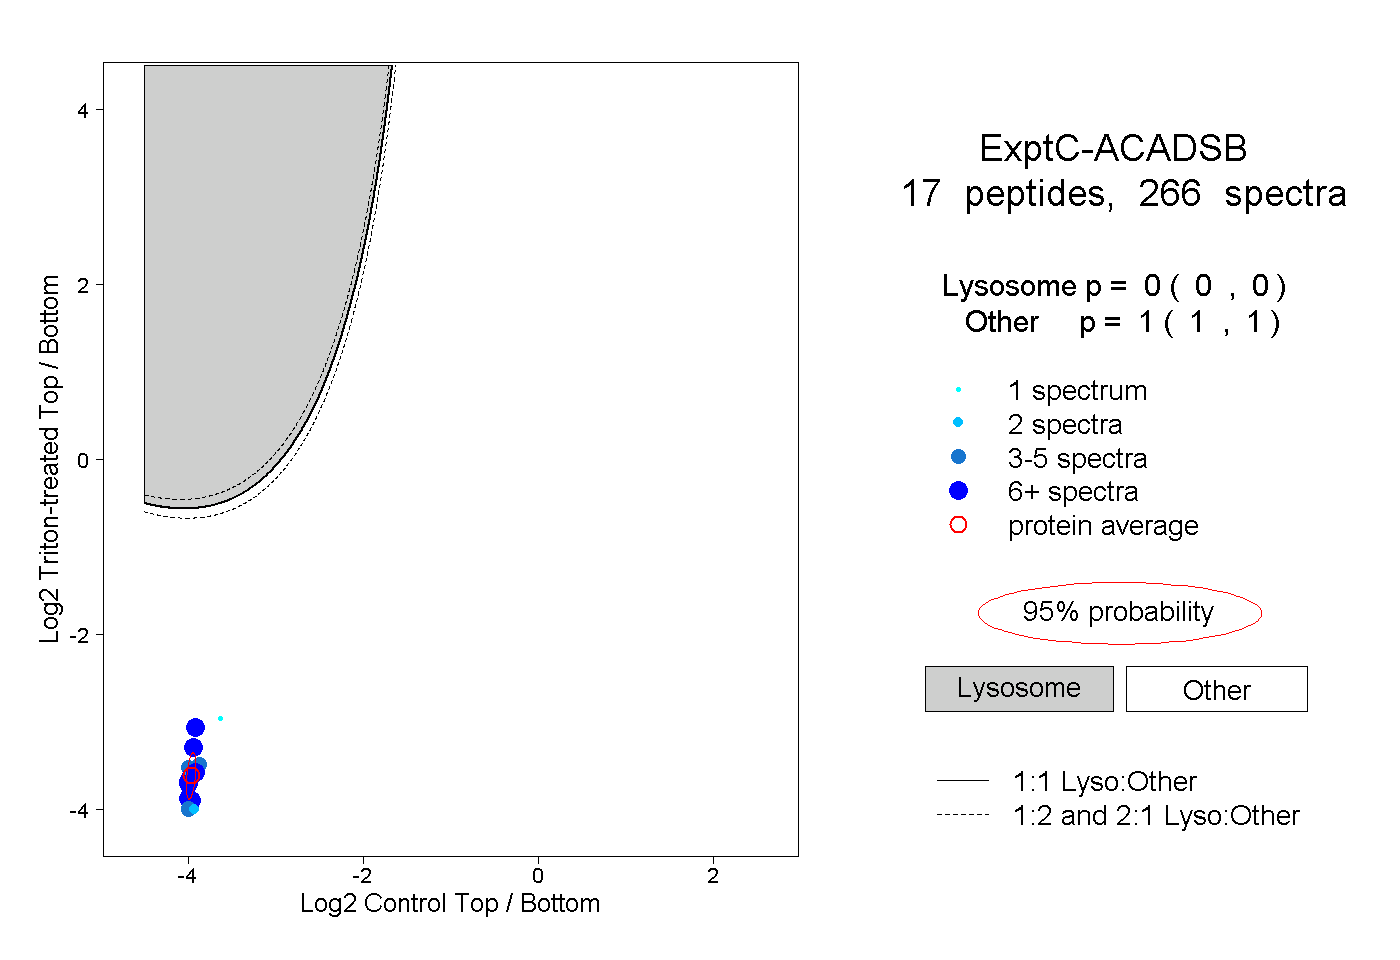 |
0.000 0.000 | 0.000 |
1.000 1.000 | 1.000 |
||||||||
| Plot | Lyso | Other | |||||||||||
| Expt D |
10 peptides |
20 spectra |
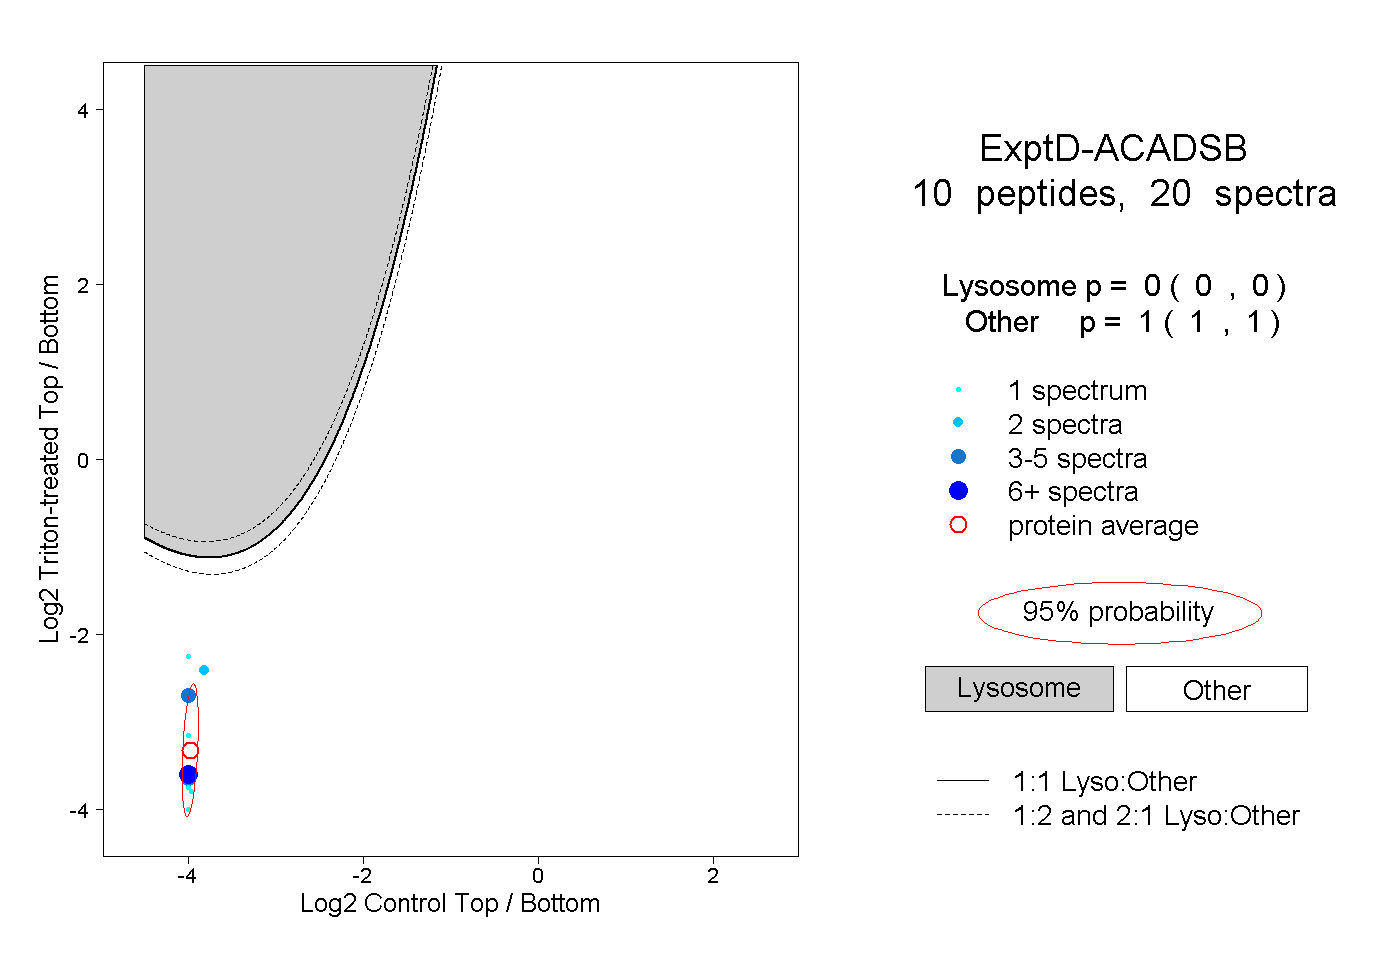 |
0.000 0.000 | 0.000 |
1.000 1.000 | 1.000 |