 2
2peptides
spectra
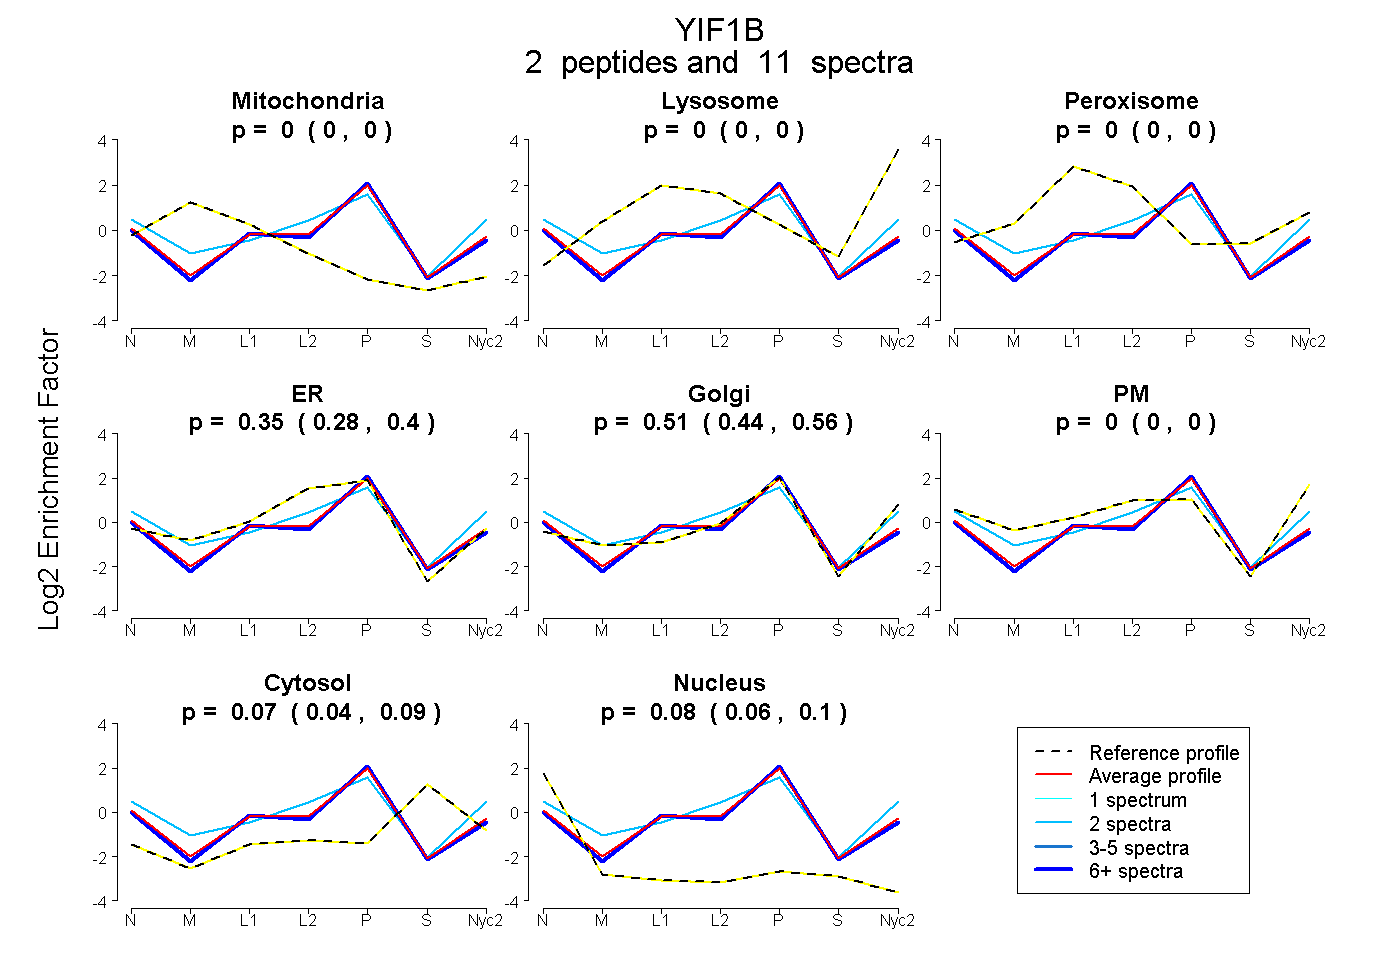
0.000 | 0.000
0.000 | 0.000
0.000 | 0.000
0.282 | 0.398
0.438 | 0.561
0.000 | 0.000
0.039 | 0.092
0.064 | 0.098
1peptide
spectrum
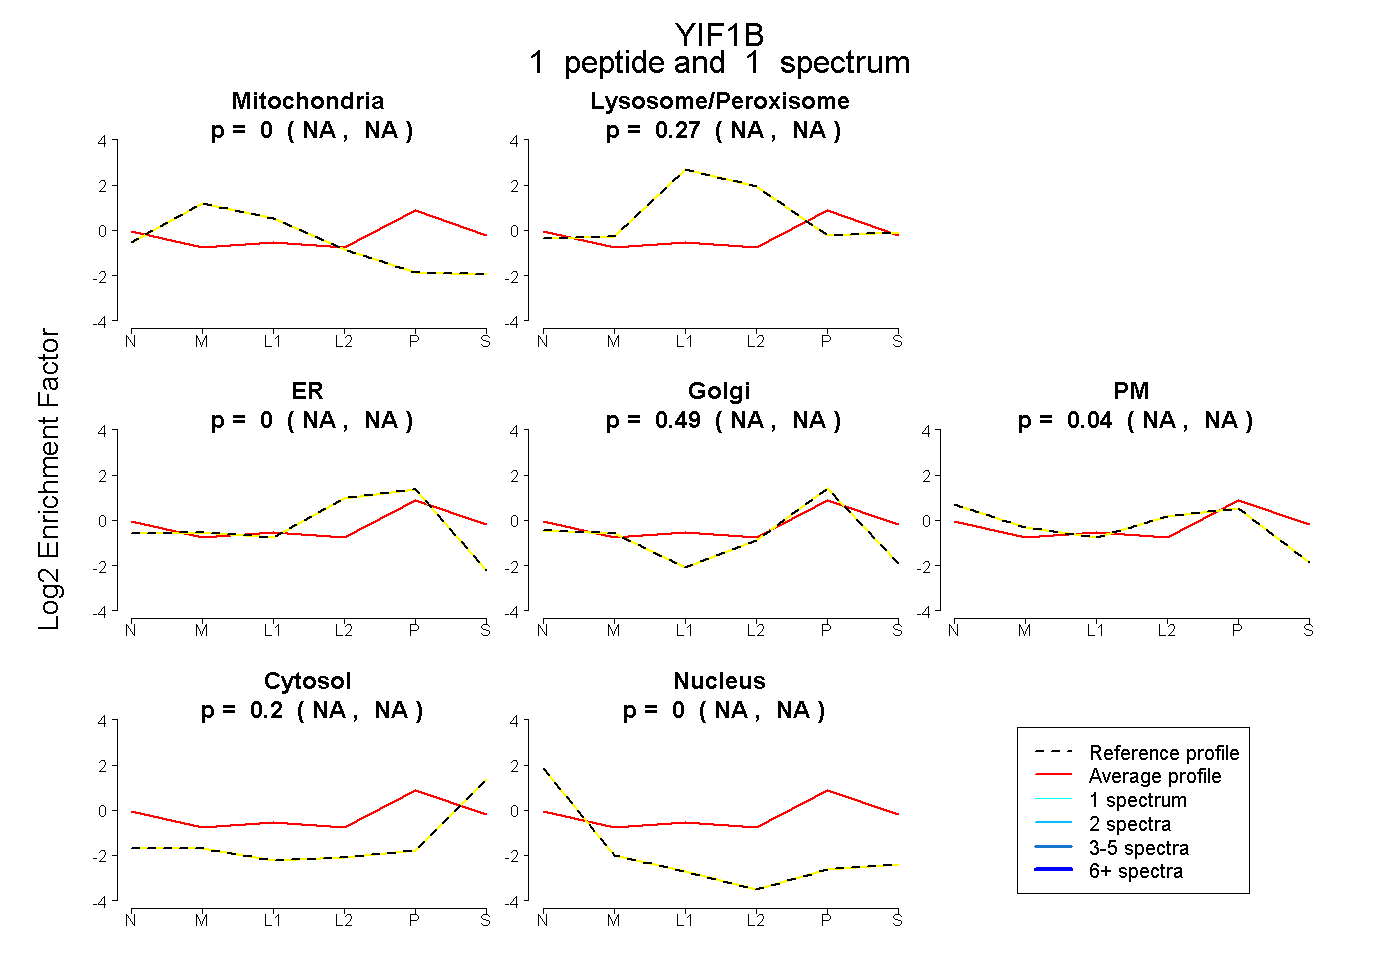
NA | NA
NA | NA
NA | NA
NA | NA
NA | NA
NA | NA
NA | NA
1peptide
spectrum
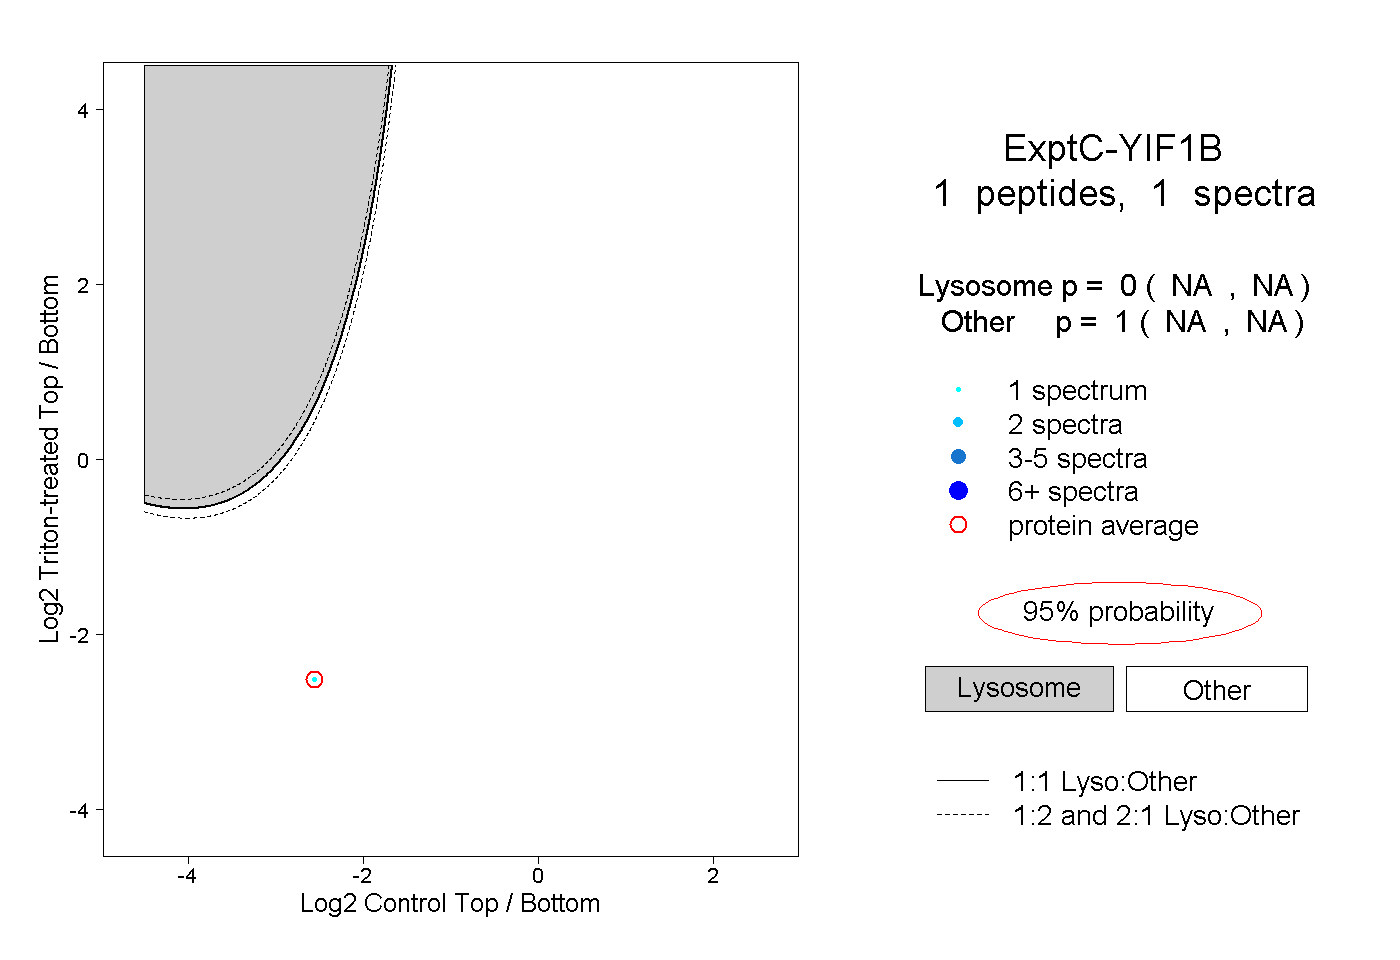
NA | NA
NA | NA
1peptide
spectrum
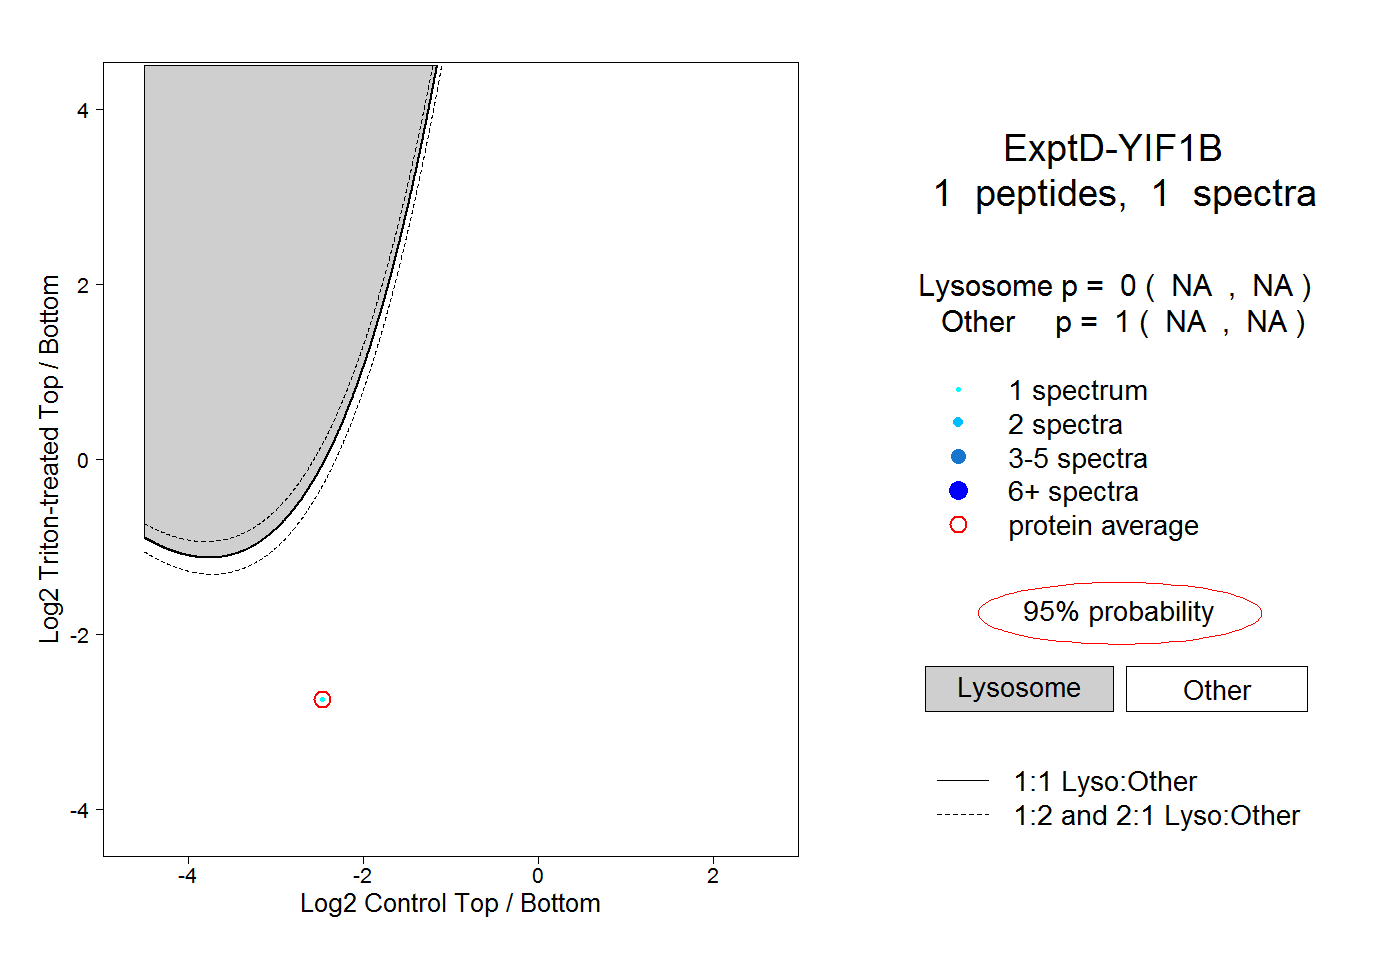
NA | NA
NA | NA